Hundreds of conserved non-coding genomic regions are independently lost in mammals - PubMed (original) (raw)
Hundreds of conserved non-coding genomic regions are independently lost in mammals
Michael Hiller et al. Nucleic Acids Res. 2012 Dec.
Abstract
Conserved non-protein-coding DNA elements (CNEs) often encode cis-regulatory elements and are rarely lost during evolution. However, CNE losses that do occur can be associated with phenotypic changes, exemplified by pelvic spine loss in sticklebacks. Using a computational strategy to detect complete loss of CNEs in mammalian genomes while strictly controlling for artifacts, we find >600 CNEs that are independently lost in at least two mammalian lineages, including a spinal cord enhancer near GDF11. We observed several genomic regions where multiple independent CNE loss events happened; the most extreme is the DIAPH2 locus. We show that CNE losses often involve deletions and that CNE loss frequencies are non-uniform. Similar to less pleiotropic enhancers, we find that independently lost CNEs are shorter, slightly less constrained and evolutionarily younger than CNEs without detected losses. This suggests that independently lost CNEs are less pleiotropic and that pleiotropic constraints contribute to non-uniform CNE loss frequencies. We also detected 35 CNEs that are independently lost in the human lineage and in other mammals. Our study uncovers an interesting aspect of the evolution of functional DNA in mammalian genomes. Experiments are necessary to test if these independently lost CNEs are associated with parallel phenotype changes in mammals.
Figures
Figure 1.
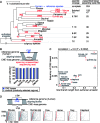
CNE losses in seven mammals. (A) For each CNE loss, we inferred the branch in the phylogenetic tree along which the loss likely happened by parsimony. The total number of observed losses is shown above each branch. Losses in branches leading to internal tree nodes have a loss or missing data for all descendant species. On the right, we show assembly coverage and available Sanger sequencing reads for the species where we search for CNE losses. (B) The vast majority of shorter assembly regions that comprise a CNE loss (region between the upstream/downstream aligning blocks is <500 bp) can be validated by unassembled sequencing reads that span the assembly region of CNE-loss species. (C) The frequency of CNE losses is strongly correlated with the branch length (neutral substitutions per site) from the eutherian (placental mammal) ancestor. (D) Plotting the distance between the aligning blocks in the reference (human genome, _y_-axis) and the CNE-loss (_x_-axis) genome shows that many CNE losses involve a large deletion. This trend is strongest in the species with the shortest branch length (horse, elephant). Linear regression line is in red.
Figure 2.
An independently lost CNE is a transcriptional enhancer in development. (A) The CNE is lost independently in the rat and guinea pig lineage (lacking any sequence similarity to the genome and all unassembled traces) but is conserved over ∼450 My of vertebrate evolution. The top part shows the location of the CNE (blue) in the human genome together with the exon–intron structures of the surrounding genes (arrows indicate the transcription start site). Below is a graphical representation of pairwise genome alignments to rat and guinea pig showing that the genes but not the CNE align to both species. Syntenic aligning regions in rat and guinea pig are shown as black boxes, a single line indicates a deletion between aligning blocks and a double line indicates that the region contains sequence that does not align. Red arrows mark the ends of the up- and downstream aligning blocks and suggest that independent events led to the CNE loss in rat and guinea pig. The bottom part shows the sequence alignment where darker blue shades indicate higher sequence identity in an alignment column. (B) A transcriptional enhancer assay in transgenic mouse embryos reveals lacZ reporter expression, showing that the CNE is a spinal cord enhancer at embryonic day 13.5 (7 out of 7 embryos). (C) The expression pattern in (B) is consistent with in situ hybridization data of GDF11 at embryonic day 13.5, suggesting that this CNE is a regulatory element for GDF11. Data from Image Series 100047449, Allen Developing Mouse Brain Atlas, Seattle (WA): Allen Institute for Brain Science. ©2009.
http://developingmouse.brain-map.org
.
Figure 3.
Many independent CNE losses around the DIAPH2 gene in guinea pig and dog. (A) The DIAPH2 locus contains the largest concentration of independent CNE loss events with 13 losses within 5 Mb. Note that each pair of CNEs that are independently lost in guinea pig and dog (red) is separated by at least one CNE that is conserved in guinea pig and dog (blue), which shows that all nine CNEs are lost by independent events (as opposed to being lost by a small number of large loss events that remove several CNEs at once). None of these 13 CNEs show any evidence for transcription. DIAPH2 is likely a functional gene in both guinea pig and dog. Other genes in this locus are the non-coding RNA gene LOC643486 and the coding gene RPA4 (replication protein A4, 30 kDa). RPA4 is likely a primate-specific gene, while the CNEs all have at least placental mammal ancestry. (B) Zoom-in of the grey-boxed region in (A) illustrates how the presence of a CNE conserved in guinea pig and dog (blue) shows that the two CNEs independently lost in guinea pig and dog (red) are lost by two separate events in guinea pig and dog. The representation of pairwise alignments is as in Figure 2A.
Figure 4.
CNE loss frequencies are not uniform. (A) The observed number of CNEs lost twice and three times (red arrow) is significantly more than expected from two methods using a uniform loss model (black arrow is the calculated point estimate, histogram of simulations in grey). The observed number of 590 CNEs lost twice corresponds to a _z_-score (number of standard deviations above the simulation average) of 24 and the observed number of 28 CNEs lost 3-times corresponds to a _z_-score of 20. The maximum number of CNEs lost twice and 3-times in the simulation is 285 and 9, which gives an empirical _P_-value <0.0001 for the observed independent CNE losses. (B) All observed combinations of two independent CNE losses. The rightmost chart boundary is either the maximum of the 10 000 simulation iterations or the observed number of losses. Outgroup species are opossum, platypus, chicken, lizard or zebra finch. Human was used as the reference species.
Figure 5.
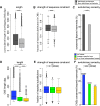
Differences in features indicative of pleiotropy between CNEs with and without losses. (A–C) We compared less pleiotropic enhancers (regions bound by p300 in only one of developing forebrain, midbrain or limb tissue (39)) to pleiotropic enhancers (bound by p300 in two or three of these tissues). (A) Less pleiotropic enhancers have fewer bases overlapping CNEs. (B) Less pleiotropic enhancers overlap CNEs that have a lower level of constraint, as measured by the fraction of substitutions that is rejected by purifying selection (calculated with GERP (27)). They are also less often extremely constrained (for 19.8% versus 25.7% more than 70% of the substitutions are rejected by selection). (C) Less pleiotropic enhancers align less frequently to non-mammalian vertebrates (chicken, zebra finch, lizard, frog or fish), showing that they are evolutionarily younger. (D–F) We compared CNEs with no detected losses to CNEs with lineage-specific and independent losses. The CNEs with losses show signatures indicative of less pleiotropy. (D) CNE length decreases with the number of loss events. (E) CNEs with loss events are depleted in extremely constrained elements. (F) CNEs with loss events are evolutionarily younger. Box plots visualize the distribution in (A), (B), (D) and (E). Bar charts are shown in (C) and (F). For visualization clarity the _Y_-axis is cut at a size of 1200 bp in (A) and 800 bp in (D). Wilcoxon rank-sum test was used in (A), (B), (D), (E), chi-square test in (C) and (F). ***_P_-value < 0.0001; **_P_-value < 0.01; *_P_-value < 0.05.
Figure 6.
Examples of CNEs lost in the human and other independent lineages. (A) Two independent losses in the human and cow lineage. (B) Three independent losses in the rat, guinea pig and human lineage. The losses in the human lineage likely happened in the human—marmoset ancestor in both cases. Legend as in Figure 2A.
Similar articles
- "Reverse Genomics" Predicts Function of Human Conserved Noncoding Elements.
Marcovitz A, Jia R, Bejerano G. Marcovitz A, et al. Mol Biol Evol. 2016 May;33(5):1358-69. doi: 10.1093/molbev/msw001. Epub 2016 Jan 6. Mol Biol Evol. 2016. PMID: 26744417 Free PMC article. - The importance of being cis: evolution of orthologous fish and mammalian enhancer activity.
Ritter DI, Li Q, Kostka D, Pollard KS, Guo S, Chuang JH. Ritter DI, et al. Mol Biol Evol. 2010 Oct;27(10):2322-32. doi: 10.1093/molbev/msq128. Epub 2010 May 21. Mol Biol Evol. 2010. PMID: 20494938 Free PMC article. - Pairs of Adjacent Conserved Noncoding Elements Separated by Conserved Genomic Distances Act as Cis-Regulatory Units.
Li L, Barth NKH, Hirth E, Taher L. Li L, et al. Genome Biol Evol. 2018 Sep 1;10(9):2535-2550. doi: 10.1093/gbe/evy196. Genome Biol Evol. 2018. PMID: 30184074 Free PMC article. - Emergence of mammals by emergency: exaptation.
Okada N, Sasaki T, Shimogori T, Nishihara H. Okada N, et al. Genes Cells. 2010 Aug;15(8):801-12. doi: 10.1111/j.1365-2443.2010.01429.x. Epub 2010 Jul 14. Genes Cells. 2010. PMID: 20633052 Review. - Conserved non-coding elements: developmental gene regulation meets genome organization.
Polychronopoulos D, King JWD, Nash AJ, Tan G, Lenhard B. Polychronopoulos D, et al. Nucleic Acids Res. 2017 Dec 15;45(22):12611-12624. doi: 10.1093/nar/gkx1074. Nucleic Acids Res. 2017. PMID: 29121339 Free PMC article. Review.
Cited by
- Pleiotropic Enhancers are Ubiquitous Regulatory Elements in the Human Genome.
Laiker I, Frankel N. Laiker I, et al. Genome Biol Evol. 2022 May 31;14(6):evac071. doi: 10.1093/gbe/evac071. Genome Biol Evol. 2022. PMID: 35552697 Free PMC article. - Phenotype loss is associated with widespread divergence of the gene regulatory landscape in evolution.
Roscito JG, Sameith K, Parra G, Langer BE, Petzold A, Moebius C, Bickle M, Rodrigues MT, Hiller M. Roscito JG, et al. Nat Commun. 2018 Nov 9;9(1):4737. doi: 10.1038/s41467-018-07122-z. Nat Commun. 2018. PMID: 30413698 Free PMC article. - Temporal analysis of enhancers during mouse cerebellar development reveals dynamic and novel regulatory functions.
Ramirez M, Badayeva Y, Yeung J, Wu J, Abdalla-Wyse A, Yang E; FANTOM 5 Consortium; Trost B, Scherer SW, Goldowitz D. Ramirez M, et al. Elife. 2022 Aug 9;11:e74207. doi: 10.7554/eLife.74207. Elife. 2022. PMID: 35942939 Free PMC article. - Convergent gene losses illuminate metabolic and physiological changes in herbivores and carnivores.
Hecker N, Sharma V, Hiller M. Hecker N, et al. Proc Natl Acad Sci U S A. 2019 Feb 19;116(8):3036-3041. doi: 10.1073/pnas.1818504116. Epub 2019 Feb 4. Proc Natl Acad Sci U S A. 2019. PMID: 30718421 Free PMC article. - A genome alignment of 120 mammals highlights ultraconserved element variability and placenta-associated enhancers.
Hecker N, Hiller M. Hecker N, et al. Gigascience. 2020 Jan 1;9(1):giz159. doi: 10.1093/gigascience/giz159. Gigascience. 2020. PMID: 31899510 Free PMC article.
References
- Waterston RH, Lindblad-Toh K, Birney E, Rogers J, Abril JF, Agarwal P, Agarwala R, Ainscough R, Alexandersson M, An P, et al. Initial sequencing and comparative analysis of the mouse genome. Nature. 2002;420:520–562. - PubMed
- Mikkelsen TS, Wakefield MJ, Aken B, Amemiya CT, Chang JL, Duke S, Garber M, Gentles AJ, Goodstadt L, Heger A, et al. Genome of the marsupial Monodelphis domestica reveals innovation in non-coding sequences. Nature. 2007;447:167–177. - PubMed


