Characterization of novel genomic alterations and therapeutic approaches using acute megakaryoblastic leukemia xenograft models - PubMed (original) (raw)
. 2012 Oct 22;209(11):2017-31.
doi: 10.1084/jem.20121343. Epub 2012 Oct 8.
Cécile K Lopez, Bastien Gerby, Cathy Ignacimouttou, Sandrine Poglio, Yannis Duffourd, Justine Guégan, Paola Rivera-Munoz, Olivier Bluteau, Vinciane Mabialah, M'boyba Diop, Qiang Wen, Arnaud Petit, Anne-Laure Bauchet, Dirk Reinhardt, Beat Bornhauser, Daniel Gautheret, Yann Lecluse, Judith Landman-Parker, Isabelle Radford, William Vainchenker, Nicole Dastugue, Stéphane de Botton, Philippe Dessen, Jean-Pierre Bourquin, John D Crispino, Paola Ballerini, Olivier A Bernard, Françoise Pflumio, Thomas Mercher
Affiliations
- PMID: 23045605
- PMCID: PMC3478932
- DOI: 10.1084/jem.20121343
Characterization of novel genomic alterations and therapeutic approaches using acute megakaryoblastic leukemia xenograft models
Clarisse Thiollier et al. J Exp Med. 2012.
Abstract
Acute megakaryoblastic leukemia (AMKL) is a heterogeneous disease generally associated with poor prognosis. Gene expression profiles indicate the existence of distinct molecular subgroups, and several genetic alterations have been characterized in the past years, including the t(1;22)(p13;q13) and the trisomy 21 associated with GATA1 mutations. However, the majority of patients do not present with known mutations, and the limited access to primary patient leukemic cells impedes the efficient development of novel therapeutic strategies. In this study, using a xenotransplantation approach, we have modeled human pediatric AMKL in immunodeficient mice. Analysis of high-throughput RNA sequencing identified recurrent fusion genes defining new molecular subgroups. One subgroup of patients presented with MLL or NUP98 fusion genes leading to up-regulation of the HOX A cluster genes. A novel CBFA2T3-GLIS2 fusion gene resulting from a cryptic inversion of chromosome 16 was identified in another subgroup of 31% of non-Down syndrome AMKL and strongly associated with a gene expression signature of Hedgehog pathway activation. These molecular data provide useful markers for the diagnosis and follow up of patients. Finally, we show that AMKL xenograft models constitute a relevant in vivo preclinical screening platform to validate the efficacy of novel therapies such as Aurora A kinase inhibitors.
Figures
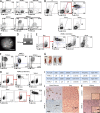
Figure 1.
Engraftment of human AMKL samples into NSG recipients. (A) Immunophenotype of patient cells at diagnosis. (B) Flow cytometry analysis of blood and BM samples from recipients 6 wk after injection of 106 AMKL1 patient cells. Cells were injected either i.v. or i.f. An antibody against the human CD45 marker was used to specifically detect human cells in BM (top), blood, and spleen from recipients. (C) FISH analysis of leukemic cells collected from primary NSG recipients engrafted with AMKL1 patient cells using probes overlapping the OTT (green) and MAL (red) loci. Note the leukemic cells present: one normal OTT signal, one normal MAL signal, and two split signals indicative of a balanced translocation. Arrows point to fusion signals. (D) RT-PCR analysis of RNA from BM cells collected from primary NSG recipients engrafted with AMKL1 patient cells to detect an OTT-MAL fusion transcript. RNA from 6133, a cell line expressing the OTT-MAL fusion, was used as a positive control. (E) Immunophenotype of AMKL1 secondary NSG recipients 6 wk after injection with 0.5 × 10⁶ patient cells. (F) Immunophenotype of AMKL7 patient cells from primary, secondary, and tertiary NSG recipients 6 wk after injection. (G) Consistent splenomegaly with nodular infiltration in AMKL7 recipients is not observed with other AMKL samples including AMKL1. “−“ is a noninjected control NSG mouse. (H) 0.5 × 10⁶ cells from tertiary NSG recipients (AMKL1) were injected i.f. into quaternary recipients. Immunophenotype of injected BM (iBM), spleen, blood, and kidney cells at end point. (I) Human CD45+ cells were purified by flow cytometry from AMKL1 and AMKL7 secondary NSG recipients and injected at different doses in NSG recipients. After 4 wk, BM sampling and flow cytometry were performed. Recipients presenting a percentage of human cells (hCD45+) >0.1% were considered positive. The frequency of leukemia-propagating cells and the lower and upper limits were calculated using the L-Calc software with a 95% confidence interval. (J) Histopathological analysis of BM (left: von Willebrand immunohistochemistry; arrow points to an immature blast showing a low staining with von Willebrand marker) and liver (right: hematoxylin and eosin staining; arrow points to a focal infiltration of blasts) from AMKL1 recipients (bottom) and noninjected control NSG mouse (top). (K) Histopathological analysis of kidney from control and AMKL1 quaternary recipients (arrow points to infiltrated blasts). Insets show a higher magnification of the same section. Bars: (C) 10 µm; (G) 5 mm; (K) 200 µm; (J and K [insets]) 100 µm.
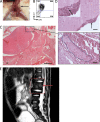
Figure 2.
CNS involvement in AMKL. (A) Recipient from AMKL7 cells showing spinal cord–localized tumor indicated by an arrow. (B) FACS analysis of the spinal cord tumor shown in A indicates that it is constituted of megakaryoblastic cells. (C) Histopathological analysis of the spinal cord. Close-up shows a spinal ganglion (inside dashed area) surrounded by leukemic cells. (D) Histopathological analysis of the brain reveals infiltration of the leptomeninges with leukemic cells. Arrow in the main image points to an infiltration of leukemic cells also shown in the top left inset; arrow in the inset points to a cell in mitosis. Bars: (C, left) 5,000 µm; (C [right] and D) 50 µm. (E) MRI image of the AMKL7 patient showing abnormal signals in several spine areas, suggesting leukemia infiltration of the nervous system. Arrow points to an abnormal signal.
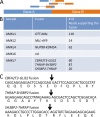
Figure 3.
High-throughput RNA-seq identifies novel recurrent fusion genes. (A) Scheme of the high-throughput sequencing reads supporting the presence of a fusion gene. (B) Summary of the fusion genes detected in the different AMKL samples engrafted into immunodeficient animals. (C) Sequence of the novel fusion transcripts found in AMKL and predicted sequence of the fusion proteins. Arrows indicate the fusion point. nd, none detected.
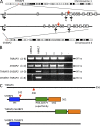
Figure 4.
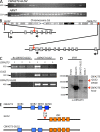
The THRAP3-SH3BP2 fusion. (A) Schematic representation of the fusion between THRAP3 (located on chromosome 1) and SH3BP2 (located on chromosome 4). Localization on chromosome and exon–intron gene structure are indicated. Red vertical arrows indicate the targeted introns. Horizontal black arrows indicate localization of the primers used for RT-PCR analysis described in B to detect the fusion transcripts. (B) RT-PCR analysis on a validation cohort of AMKL patients using the primers described in A. Bands appearing in samples 1, 2, and 3 for the THRAP-SH3BP2 fusion were not confirmed by direct sequencing and therefore represent nonspecific amplification. (C) Schematic representation of the THRAP3, SH3BP2, THRAP3-SH3BP2, and SH3BP2-THRAP3 predicted proteins. Red arrows indicate fusion points on each protein.
Figure 5.
The CBFA2T3-GLIS2 fusion is recurrent in AMKL. (A) RT-PCR analysis on a validation cohort of AMKL patients using primers located on CBFA2T3 exon 11 and GLIS2 exon 3 (top). Detection of the ARNT transcript was used as an RNA quality control. (B) Schematic representation of the chromosome 16 chromosomal inversion leading to the fusion between CBFA2T3 and GLIS2. Localizations on chromosome and exon–intron gene structures are indicated. Red vertical arrows indicate the introns targeted by the inversion. Horizontal black arrows indicate localization of the primers used for RT-PCR analysis described in C to detect the fusion transcript. (C) RT-PCR analysis of CBFA2T3 and GLIS2 expression in patients with or without the CBFA2T3-GLIS2 fusion. White line indicates that intervening lanes have been spliced out. (D) Western blot analysis of AMKL7 cells using an anti-CBFA2T3 antibody. AMKL7 cell lysates were prepared from fresh cells obtained from tertiary recipients. For controls, 293T cells were transfected with empty or CBFA2T3- or CBFA2T3-GLIS2–encoding vectors. (E) Schematic representation of the CBFA2T3, GLIS2, and CBFA2T3-GLIS2 predicted proteins. Red arrows indicate fusion points on each protein. ZNF, Krüppel-like zinc finger domain.
Figure 6.
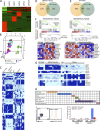
CBFA2T3-GLIS2 AMKLs exhibit a distinct expression signature. (A) Expression analysis of RNA-seq data showing molecular signature of each sample versus all of the other samples. (B) Genes implicated in the signatures indicated in A were used to perform principal component analysis. (C) Class comparison of AMKL samples presenting the OTT-MAL fusion, CBFA2T3-GLIS2 fusion, acquired trisomy 21, and other alterations. (D) Venn diagram representing common genes between RNA-seq and microarray signatures of AMKL samples presenting CBFA2T3-GLIS2 fusion. (E) Venn diagram representing common genes between RNA-seq and microarray signatures of AMKL samples presenting OTT-MAL fusion. (F) GSEA using a Hedgehog gene list comparing OTT-MAL with CBFA2T3-GLIS2 patients (left) and CBFA2T3-GLIS2 with other non-DS AMKL patients (right). The leading edge genes for each comparison are represented in the bottom panels. FDR, false discovery rate. (G) Selected genes from molecular signatures of the different AMKL subgroups. Asterisk indicates the patient presenting the NUP98-KDM5A fusion. (H) Schematic representation of all fusion genes found in AMKL samples. Hatched squares represent patients with no available material for detection of the novel fusions by bispecific PCR but for which global expression data are available. (I) Flow cytometry analysis of CD56 expression on AMKL7 (CBFA2T3-GLIS2) leukemic blasts (right). Comparison of the CD56 expression between AMKL4 (NUP98-KDM5A) and AMKL7. (J) ChIP analysis using a CBFA2T3-specific antibody or a nonspecific antibody (IgG) on AMKL7 cells or control K562 cells. Quantitative PCR was then performed on immunoprecipitated DNA using primer pairs located in the proximal NCAM1 promoter or in the 3′ UTR. Error bars indicate mean ± SEM.
Figure 7.
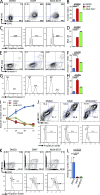
Aurora kinase inhibitors inhibit proliferation of AMKL patient blasts in vitro. (A) AMKL7 cells purified from immunodeficient recipients were cultured in vitro in the presence of DMSO (control), 5 µM DiMF, or 250 nM MLN8237 for 72 h. A representative flow cytometry analysis of CD41 and CD42 megakaryocyte–specific markers is shown. (B) Histogram representation of CD41+CD42+ maturing megakaryocyte elements shown in A. (C) Representative ploidy analysis of cells treated as in A. (D) Histogram representation of cells with a ploidy > 4n shown in C. (E) Representative apoptosis analysis of cells treated as in A. (F) Histogram representation of apoptotic cells (AnnexinV+7AAD− cells) shown in E. (G) Representative flow cytometry analysis of cleaved caspase 3 in cells treated as in A. (H) Histogram representation of cleaved caspase 3–positive cells shown in G. (B, D, F, and H) Mean value ± SEM of duplicate (B and D) or triplicate (F and H) experiments is shown. (I) Proliferation of AMKL7 leukemic cells upon treatment with aurora kinase inhibitors. Mean ± SEM of the number of viable cells (trypan blue exclusion, duplicate experiments) is shown. (J) Effect of 5 µM DiMF and 250 nM MLN8237 treatment on AMKL1 cells. Flow cytometry analysis of ploidy and differentiation after 6 d of in vitro treatment. (K) Effect of 5 µM DiMF and 250 nM MLN8237 treatment on AMKL4 cells. Flow cytometry analysis of ploidy and differentiation after 4 d of in vitro treatment. (L) Viable number of AMKL4 cells after 4 d of treatment as in K. Means ± SEM of duplicate experiments are shown.
Figure 8.
MLN8237 efficiently reduces disease burden and prolongs survival of a xenograft model of human AMKL expressing the CBFA2T3-GLIS2 fusion. (A) Schematic representation of the in vivo drug trial with MLN8237. 2 × 10⁶ AMKL7 cells were injected per recipient. 10 d later, two groups of seven recipients were treated either with placebo or 15 mg/kg MLN8237. BM and blood were sampled at the indicated time points for analysis. (B) BM cells collected at day 27 were analyzed by flow cytometry. (left) A representative flow cytometry analysis of h–c-KIT, hCD41, and hCD42 markers is shown. (right) Scatter plots indicate the result for all recipients. Horizontal lines indicate mean. (C) Representation of the onset of hind leg paralysis (Placebo: n = 7, MLN8237: n = 5). (D) Representative analysis (left) and histogram representation (right) of the blood samples collected at day 55. (Placebo: n = 7, MLN8237: n = 5). (E) Kaplan-Meier survival curves of placebo-treated (n = 7) and MLN8237-treated (n = 5) animals. (F) BM cells collected at day 70 were analyzed by flow cytometry. (left) A representative flow cytometry analysis of cKIT, CD41, and CD42 markers is shown. (right) Histogram representation of the results (Placebo: n = 2, MLN8237: n = 5). (D and F) Error bars indicate mean ± SEM.
Similar articles
- Prognostic impact of specific molecular profiles in pediatric acute megakaryoblastic leukemia in non-Down syndrome.
Hara Y, Shiba N, Ohki K, Tabuchi K, Yamato G, Park MJ, Tomizawa D, Kinoshita A, Shimada A, Arakawa H, Saito AM, Kiyokawa N, Tawa A, Horibe K, Taga T, Adachi S, Taki T, Hayashi Y. Hara Y, et al. Genes Chromosomes Cancer. 2017 May;56(5):394-404. doi: 10.1002/gcc.22444. Epub 2017 Feb 14. Genes Chromosomes Cancer. 2017. PMID: 28063190 - An Inv(16)(p13.3q24.3)-encoded CBFA2T3-GLIS2 fusion protein defines an aggressive subtype of pediatric acute megakaryoblastic leukemia.
Gruber TA, Larson Gedman A, Zhang J, Koss CS, Marada S, Ta HQ, Chen SC, Su X, Ogden SK, Dang J, Wu G, Gupta V, Andersson AK, Pounds S, Shi L, Easton J, Barbato MI, Mulder HL, Manne J, Wang J, Rusch M, Ranade S, Ganti R, Parker M, Ma J, Radtke I, Ding L, Cazzaniga G, Biondi A, Kornblau SM, Ravandi F, Kantarjian H, Nimer SD, Döhner K, Döhner H, Ley TJ, Ballerini P, Shurtleff S, Tomizawa D, Adachi S, Hayashi Y, Tawa A, Shih LY, Liang DC, Rubnitz JE, Pui CH, Mardis ER, Wilson RK, Downing JR. Gruber TA, et al. Cancer Cell. 2012 Nov 13;22(5):683-97. doi: 10.1016/j.ccr.2012.10.007. Cancer Cell. 2012. PMID: 23153540 Free PMC article. - Clinical impact of genomic characterization of 15 patients with acute megakaryoblastic leukemia-related malignancies.
Lalonde E, Rentas S, Wertheim G, Cao K, Surrey LF, Lin F, Zhao X, Obstfeld A, Aplenc R, Luo M, Li MM. Lalonde E, et al. Cold Spring Harb Mol Case Stud. 2021 Apr 8;7(2):a005975. doi: 10.1101/mcs.a005975. Print 2021 Apr. Cold Spring Harb Mol Case Stud. 2021. PMID: 33832921 Free PMC article. - The biology of pediatric acute megakaryoblastic leukemia.
Gruber TA, Downing JR. Gruber TA, et al. Blood. 2015 Aug 20;126(8):943-9. doi: 10.1182/blood-2015-05-567859. Epub 2015 Jul 17. Blood. 2015. PMID: 26186939 Free PMC article. Review. - The changing scenario of non-Down syndrome acute megakaryoblastic leukemia in children.
Masetti R, Guidi V, Ronchini L, Bertuccio NS, Locatelli F, Pession A. Masetti R, et al. Crit Rev Oncol Hematol. 2019 Jun;138:132-138. doi: 10.1016/j.critrevonc.2019.04.011. Epub 2019 Apr 15. Crit Rev Oncol Hematol. 2019. PMID: 31092368 Review.
Cited by
- Developmental interplay between transcriptional alterations and a targetable cytokine signaling dependency in pediatric ETO2::GLIS2 leukemia.
Alonso-Pérez V, Galant K, Boudia F, Robert E, Aid Z, Renou L, Barroca V, Devanand S, Babin L, Rouiller-Fabre V, Moison D, Busso D, Piton G, Metereau C, Abermil N, Ballerini P, Hirsch P, Haddad R, Martinovic J, Petit A, Lapillonne H, Brunet E, Mercher T, Pflumio F. Alonso-Pérez V, et al. Mol Cancer. 2024 Sep 20;23(1):204. doi: 10.1186/s12943-024-02110-y. Mol Cancer. 2024. PMID: 39304903 Free PMC article. - The ETO2 transcriptional cofactor maintains acute leukemia by driving a MYB/EP300-dependent stemness program.
Fagnan A, Aid Z, Baille M, Drakul A, Robert E, Lopez CK, Thirant C, Lecluse Y, Rivière J, Ignacimouttou C, Salmoiraghi S, Anguita E, Naimo A, Marzac C, Pflumio F, Malinge S, Wichmann C, Huang Y, Lobry C, Chaumeil J, Soler E, Bourquin JP, Nerlov C, Bernard OA, Schwaller J, Mercher T. Fagnan A, et al. Hemasphere. 2024 Jun 19;8(6):e90. doi: 10.1002/hem3.90. eCollection 2024 Jun. Hemasphere. 2024. PMID: 38903535 Free PMC article. - Clinical Analysis of Pediatric Acute Megakaryocytic Leukemia With CBFA2T3-GLIS2 Fusion Gene.
Du Y, Yang L, Qi S, Chen Z, Sun M, Wu M, Wu B, Tao F, Xiong H. Du Y, et al. J Pediatr Hematol Oncol. 2024 Mar 1;46(2):96-103. doi: 10.1097/MPH.0000000000002822. Epub 2024 Feb 1. J Pediatr Hematol Oncol. 2024. PMID: 38315896 Free PMC article. - CBFA2T3::GLIS2 pediatric acute megakaryoblastic leukemia is sensitive to BCL-XL inhibition by navitoclax and DT2216.
Gress V, Roussy M, Boulianne L, Bilodeau M, Cardin S, El-Hachem N, Lisi V, Khakipoor B, Rouette A, Farah A, Théret L, Aubert L, Fatima F, Audemard É, Thibault P, Bonneil É, Chagraoui J, Laramée L, Gendron P, Jouan L, Jammali S, Paré B, Simpson SM, Tran TH, Duval M, Teira P, Bittencourt H, Santiago R, Barabé F, Sauvageau G, Smith MA, Hébert J, Roux PP, Gruber TA, Lavallée VP, Wilhelm BT, Cellot S. Gress V, et al. Blood Adv. 2024 Jan 9;8(1):112-129. doi: 10.1182/bloodadvances.2022008899. Blood Adv. 2024. PMID: 37729615 Free PMC article. - Spi1 R235C point mutation confers hypersensitivity to radiation-induced acute myeloid leukemia in mice.
Brown N, Finnon R, Finnon P, McCarron R, Cruz-Garcia L, O'Brien G, Herbert E, Scudamore CL, Morel E, Badie C. Brown N, et al. iScience. 2023 Aug 3;26(9):107530. doi: 10.1016/j.isci.2023.107530. eCollection 2023 Sep 15. iScience. 2023. PMID: 37664628 Free PMC article.
References
- Ballerini P., Blaise A., Mercher T., Pellegrino B., Perot C., van den Akker J., Gatbois E., Adam M., Douay L., Berger R., et al. 2003. A novel real-time RT-PCR assay for quantification of OTT-MAL fusion transcript reliable for diagnosis of t(1;22) and minimal residual disease (MRD) detection. Leukemia. 17:1193–1196 10.1038/sj.leu.2402914 - DOI - PubMed
- Borkhardt A., Haas O.A., Strobl W., Repp R., Mann G., Gadner H., Lampert F. 1995. A novel type of MLL/AF10 fusion transcript in a child with acute megakaryocytic leukemia (AML-M7). Leukemia. 9:1796–1797 - PubMed
MeSH terms
Substances
LinkOut - more resources
Full Text Sources
Miscellaneous
