Neuropeptides control the dynamic behavior of airway mucosal dendritic cells - PubMed (original) (raw)
Neuropeptides control the dynamic behavior of airway mucosal dendritic cells
Sabrina Voedisch et al. PLoS One. 2012.
Abstract
The airway mucosal epithelium is permanently exposed to airborne particles. A network of immune cells patrols at this interface to the environment. The interplay of immune cells is orchestrated by different mediators. In the current study we investigated the impact of neuronal signals on key functions of dendritic cells (DC). Using two-photon microscopic time-lapse analysis of living lung sections from CD11c-EYFP transgenic mice we studied the influence of neuropeptides on airway DC motility. Additionally, using a confocal microscopic approach, the phagocytotic capacity of CD11c(+) cells after neuropeptide stimulation was determined. Electrical field stimulation (EFS) leads to an unspecific release of neuropeptides from nerves. After EFS and treatment with the neuropeptides vasoactive intestinal peptide (VIP) or calcitonin gene-related peptide (CGRP), airway DC in living lung slices showed an altered motility. Furthermore, the EFS-mediated effect could partially be blocked by pre-treatment with the receptor antagonist CGRP(8-37). Additionally, the phagocytotic capacity of bone marrow-derived and whole lung CD11c(+) cells could be inhibited by neuropeptides CGRP, VIP, and Substance P. We then cross-linked these data with the in vivo situation by analyzing DC motility in two different OVA asthma models. Both in the acute and prolonged OVA asthma model altered neuropeptide amounts and DC motility in the airways could be measured. In summary, our data suggest that neuropeptides modulate key features motility and phagocytosis of mouse airway DC. Therefore altered neuropeptide levels in airways during allergic inflammation have impact on regulation of airway immune mechanisms and therefore might contribute to the pathophysiology of asthma.
Conflict of interest statement
Competing Interests: The authors have declared that no competing interests exist.
Figures
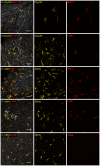
Figure 1. Characterization of CD11c+ cells in mouse main bronchi.
Mouse airways of the CD11c-EYFP reporter mouse (CD11c in yellow) or of the CX3CR1+/gfp transgenic mouse (CX3CR1 in yellow) were stained as whole-mounts against MHC-II (red), F4/80 (red) or CD68 (red) as indicated. Airway epithelium stained with cytokeratin (Ck) is shown in grey. Left column shows merges of all acquired channels. Other columns show according single channel images. Image projections were generated with Imaris (Bitplane) from raw confocal _z_-stacks. Scale: 40 µm.
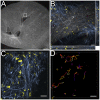
Figure 2. Analysis of DC motility in mouse main bronchi.
Main bronchi of mouse living lung sections were analyzed by two-photon time-lapse microscopy. (A) 300 µm thick mouse living lung slice visualized with a stereomicroscope. Box indicates a typical region used for three-dimensional time-lapse microscopy. Scale: 1 mm. (B) Three-dimensional stack projection of DC in the airway epithelium. CD11c+ cells shown in yellow, SHG signal of airway collagen fibers in blue (two-photon excitation: 920 nm), autofluorescence of airway epithelium in grey (two-photon excitation: 820 nm). Side and bottom panel show side views of the stack in yz and _xz_-direction, respectively. Scale: 40 µm. (C) Example of a three-dimensional stack projection of a single analysis time point. CD11c+ cells of CD11c-EYFP transgenic mice are shown in yellow; SHG signal of collagen fibers of the airway in blue (two-photon excitation: 920 nm). Scale: 50 µm. (D) Color-coded tracks of DC during the total analysis time of 1 h image acquisition (resume pertains to C). Blue color code marks the start of imaging; white, the end of imaging. Scale: 50 µm.
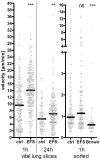
Figure 3. Motility of CD11c+ cells after electrical field stimulation.
Mean velocities of lung CD11c+ cells were determined under untreated conditions (ctrl) or after different time-points (1 h, 24 h) of EFS. Each dot represents the mean velocity of an individual cell; black horizontal bars indicate the medians. Data of living lung slices show a pool of two independent experiments (left part). Mean velocities of _in vitro_-cultured magnetically sorted CD11c+ total lung cells (right part) were acquired from one experiment; Brownian Motion (Brown) was determined by analyzing non-motile paraformaldehyde-fixed cells. Mann Whitney statistical test; ns not significant; * p<0.05; ** p<0.01; *** p<0.001.
Figure 4. Motility of neuropeptide-treated CD11c+ cells.
Mean velocities of lung CD11c+ cells and airway DC five minutes after neuropeptide treatment. Groups as indicated. For antagonistic treatment, slices were pre-treated with CGRP8–37 five minutes prior to EFS and analyzed 1 h after EFS. Each dot represents the mean velocity of an individual cell; black horizontal bars indicate the medians. Data of living lung slices and _in vitro_-generated BMDC show a pool of three independent experiments for each group. Mann Whitney statistical test; ns not significant; * p<0.05; ** p<0.01; *** p<0.001.
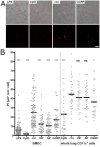
Figure 5. Phagocytosis capacity of CD11c+ cells after neuropeptide treatment.
(A) Representative confocal images of _in vitro_-cultured BMDC after different treatments as indicated. Upper panel shows a merge of red fluorescence of phagocytosed E. coli pHrodo particles and transmitted light channel to visualize all cells. Lower panel shows only the red fluorescence according to images of the upper panel. Lower panel images were used to determine the total area of red fluorescence in each image with ImageJ software. Scale: 40 µm. (B) Graph of phagocytosis indices (PI) of BMDC and magnetically sorted total lung CD11c+ cells. Cells were neuropeptide or control treated for five minutes. E. coli pHrodo particles were then applied for 2 h. Beforehand a fraction of cells was triggered over night with LPS (three independent experiments). To inhibit phagocytosis, another fraction of cells was treated with Cytochalasin D (one experiment for BMDC, two experiments for whole lung CD11c+ cells). Neuropeptide-treated groups (0.1 nM VIP, 1 µM SP, 1 nM CGRP) were compared to a water-treated group (ctrl) (four independent experiments for BMDC and two independent experiments for whole lung CD11c+ cells). Each dot represents PI of one image. Black horizontal bars indicate the means. Per well two images were acquired. Unpaired statistical _t_-test; ns not significant; * p<0.05; ** p<0.01; *** p<0.001.
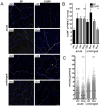
Figure 6. Determination of neuropeptide amounts and of DC motility in mouse airways in an acute and prolonged model of allergic airway inflammation.
(A) Representative confocal _z_-stack projections of mouse airways stained as whole-mounts against the pan-neuronal marker PGP9.5 (blue) and neuropeptides SP or CGRP (yellow), respectively. Airways of control-treated and asthmatic mice were analyzed (acute model: i.p. booster on days 14 and 21, challenge and analysis on day 27; prolonged protocol: i.p. booster on days 14 and 21, two additional challenges on days 27 and 28, final challenge on day 35, analysis day 36). The total area of fluorescence signals of maximum intensity projections of _z_-stack images was determined by using Imaris and ImageJ software. (B) The total area of neuropeptide fluorescence signal (SP or CGRP signal) was set into relation to the area of all nerves (PGP9.5 signal). This ratio was determined for six regions of each airway. Per group three mice donating one airway each were analyzed. Unpaired statistical _t_-test; outliers were determined by Grubb’s test; ns not significant; * p<0.05; ** p<0.01; *** p<0.001. Scale: 40 µm. (C) Mean velocities of airway DC were determined both, in an acute OVA asthma model and in a model using a prolonged protocol and in their respective control groups (ctrl) as indicated. Each dot represents the mean velocity of an individual cell; black horizontal bars indicate the medians. Data of living lung slices show a pool of three (acute) to four (prolonged) independent experiments. Mann-Whitney statistical test; ns not significant; * p<0.05; ** p<0.01; *** p<0.001.
Similar articles
- The neuropeptide calcitonin gene-related peptide affects allergic airway inflammation by modulating dendritic cell function.
Rochlitzer S, Veres TZ, Kühne K, Prenzler F, Pilzner C, Knothe S, Winkler C, Lauenstein HD, Willart M, Hammad H, Müller M, Krug N, Lambrecht BN, Braun A. Rochlitzer S, et al. Clin Exp Allergy. 2011 Nov;41(11):1609-21. doi: 10.1111/j.1365-2222.2011.03822.x. Epub 2011 Jul 14. Clin Exp Allergy. 2011. PMID: 21752117 - Mediation of the JNC/ILC2 pathway in DBP-exacerbated allergic asthma: A molecular toxicological study on neuroimmune positive feedback mechanism.
Xie X, Li Y, Yan B, Peng Q, Yao R, Deng Q, Li J, Wu Y, Chen S, Yang X, Ma P. Xie X, et al. J Hazard Mater. 2024 Mar 5;465:133360. doi: 10.1016/j.jhazmat.2023.133360. Epub 2023 Dec 23. J Hazard Mater. 2024. PMID: 38157815 - Spatiotemporal and functional behavior of airway dendritic cells visualized by two-photon microscopy.
Veres TZ, Voedisch S, Spies E, Tschernig T, Braun A. Veres TZ, et al. Am J Pathol. 2011 Aug;179(2):603-9. doi: 10.1016/j.ajpath.2011.04.039. Epub 2011 Jun 25. Am J Pathol. 2011. PMID: 21708113 Free PMC article. - [Role of neurotrophin and neuropeptides in bronchial asthma].
Pałgan K, Dziedziczko A. Pałgan K, et al. Pol Merkur Lekarski. 2004 Feb;16(92):101-3. Pol Merkur Lekarski. 2004. PMID: 15176288 Review. Polish. - Vascular actions of airway neuropeptides.
Laitinen LA, Laitinen A, Salonen RO, Widdicombe JG. Laitinen LA, et al. Am Rev Respir Dis. 1987 Dec;136(6 Pt 2):S59-64. doi: 10.1164/ajrccm/136.6_Pt_2.S59. Am Rev Respir Dis. 1987. PMID: 3318604 Review.
Cited by
- Dendritic cell dysfunction and diabetic sensory neuropathy in the cornea.
Gao N, Yan C, Lee P, Sun H, Yu FS. Gao N, et al. J Clin Invest. 2016 May 2;126(5):1998-2011. doi: 10.1172/JCI85097. Epub 2016 Apr 11. J Clin Invest. 2016. PMID: 27064280 Free PMC article. - Epithelium-generated neuropeptide Y induces smooth muscle contraction to promote airway hyperresponsiveness.
Li S, Koziol-White C, Jude J, Jiang M, Zhao H, Cao G, Yoo E, Jester W, Morley MP, Zhou S, Wang Y, Lu MM, Panettieri RA Jr, Morrisey EE. Li S, et al. J Clin Invest. 2016 May 2;126(5):1978-82. doi: 10.1172/JCI81389. Epub 2016 Apr 18. J Clin Invest. 2016. PMID: 27088802 Free PMC article. - Clinical view on the importance of dendritic cells in asthma.
Gaurav R, Agrawal DK. Gaurav R, et al. Expert Rev Clin Immunol. 2013 Oct;9(10):899-919. doi: 10.1586/1744666X.2013.837260. Expert Rev Clin Immunol. 2013. PMID: 24128155 Free PMC article. Review. - Translational Immunoimaging and Neuroimaging Demonstrate Corneal Neuroimmune Crosstalk.
Hamrah P, Seyed-Razavi Y, Yamaguchi T. Hamrah P, et al. Cornea. 2016 Nov;35 Suppl 1(Suppl 1):S20-S24. doi: 10.1097/ICO.0000000000001014. Cornea. 2016. PMID: 27631352 Free PMC article. Review. - Pain and immunity: implications for host defence.
Baral P, Udit S, Chiu IM. Baral P, et al. Nat Rev Immunol. 2019 Jul;19(7):433-447. doi: 10.1038/s41577-019-0147-2. Nat Rev Immunol. 2019. PMID: 30874629 Free PMC article. Review.
References
- Marriott I, Bost KL (2001) Expression of authentic substance P receptors in murine and human dendritic cells. J Neuroimmunol 114: 131–141. - PubMed
- Rochlitzer S, Veres TZ, Kuhne K, Prenzler F, Pilzner C, et al... (2011) The neuropeptide calcitonin gene-related peptide affects allergic airway inflammation by modulating dendritic cell function. ClinExpAllergy. - PubMed
- Barnes PJ (1986) Asthma as an axon reflex. Lancet 1: 242–245. - PubMed
Publication types
MeSH terms
Substances
Grants and funding
This work was supported by Deutsche Forschungsgemeinschaft (SFB587/B4), Fraunhofer ITEM (Fraunhofer Institute for Toxicology and Experimental Medicine). The funders had no role in study design, data collection and analysis, decision to publish, or preparation of the manuscript.
LinkOut - more resources
Full Text Sources
Molecular Biology Databases
Research Materials
