Defining the status of RNA polymerase at promoters - PubMed (original) (raw)
Defining the status of RNA polymerase at promoters
Leighton J Core et al. Cell Rep. 2012.
Abstract
Recent genome-wide studies in metazoans have shown that RNA polymerase II (Pol II) accumulates to high densities on many promoters at a rate-limited step in transcription. However, the status of this Pol II remains an area of debate. Here, we compare quantitative outputs of a global run-on sequencing assay and chromatin immunoprecipitation sequencing assays and demonstrate that the majority of the Pol II on Drosophila promoters is transcriptionally engaged; very little exists in a preinitiation or arrested complex. These promoter-proximal polymerases are inhibited from further elongation by detergent-sensitive factors, and knockdown of negative elongation factor, NELF, reduces their levels. These results not only solidify the notion that pausing occurs at most promoters, but demonstrate that it is the major rate-limiting step in early transcription at these promoters. Finally, the divergent elongation complexes seen at mammalian promoters are far less prevalent in Drosophila, and this specificity in orientation correlates with directional core promoter elements, which are abundant in Drosophila.
Copyright © 2012 The Authors. Published by Elsevier Inc. All rights reserved.
Figures
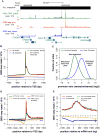
Figure 1. RNA polymerase distribution on mRNA-encoding genes using GRO-seq
(A) A representative view of GRO-seq data from S2 cells in the UCSC genome browser (Kent WJ, Sugnet CW, et al, 2002). GRO-seq reads (reads/base) aligning to the plus strand are shown in red; minus strand in blue. ChIP-seq for total Pol II (a-Rpb3) is shown in green (reads/25bp bin), and gene annotations are shown at the bottom in blue. (B) GRO-seq data aligned to Transcription Start Sites (TSSs). For all genes, reads aligning to the sense strand of the gene are in red; antisense strand in blue. For non-bidirectional genes (head-to-head promoters within 1 kb removed), reads aligning to the sense strand of the gene are in green; antisense strand in orange. (C) Comparison of directionality of Drosophila and human promoters. The distribution of the ratios of sense and antisense reads around promoters (log2) is plotted for active promoters (>25 reads) in IMR90 cells (green) and Drosophila S2 cells (blue). How different types of directionality of transcription from promoters are reflected in the ratio are indicated in italicized lettering. (D) GRO-seq profiles from −/+ 1.5 kb relative to TSS are shown for all human promoters (green, sense; orange, antisense) or human promoters that contain a TATA box (red, sense; blue, antisense). (E) GRO-seq data aligned to gene end for all genes (red, sense; blue, antisense), and after convergent genes within 1.5 kb are removed (green, sense; orange, antisense). See Also Figure S1.
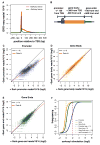
Figure 2. Sarkosyl-dependent run-ons identify distinct forms of polymerase at promoters relative to downstream gene regions
(A) Composite profile of GRO-seq data showing the density reads in 10bp windows from −200bp to +500bp relative to TSSs for Run-ons performed with or without sarkosyl. Y-axis represents read/window/million reads sequenced. The number of genes shown = 11,800. (B) Schematic showing how GRO-seq signal was quantified at promoters, the gene body, or at gene ends. After removing genes based on overlaps and filtering for genes that have active promoters, the number of genes for this analysis = 4,652. (C-E) Scatter plots showing the effects of sarkosyl on run-on signal in promoters (C) or genes (D), or at gene ends (E). (F) Cumulative distribution plots showing the differential effect of sarkosyl at promoters (blue) versus within genes (orange), or at gene ends (green). The average effect in the gene, promoter, and the Hsp70 promoter are denoted by the hashed vertical lines. The effect at the Hsp70 promoter is shown as a hashed vertical line in red. The non-logged value for the fold effect after sarkosyl stimulation is shown in the legend. See Also Figure S2.
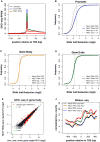
Figure 3. Use of GRO-seq to examine function of NELF at promoters and identification of genes affected by NELF knockdown
(A) Composite profile of GRO-seq data showing the density reads in 10bp windows from +/−100bp relative to TSSs for untreated (green), mock- (blue), and NELF-depleted (red) cells. The number of genes shown = 11,800. (B -D) Cumulative distribution plots showing the overall effect of NELF RNAi on polymerase density in promoters (B) or genes (C), or at gene ends (D). Figure panels and legends are displayed as in Figure 2. (E) Scatter plot showing the comparison of GRO-seq signal in the gene body region in mock – or RNAi – treated cells. Genes were identified as significantly affected (red) using edgeR (Robinson MD, McCarthy DJ, and Smyth GK, 2010), with an FDR of 0.01. The green line represents a 1:1 fit. (F) MNase-seq patterns relative to TSSs in mock – or RNAi – treated cells for genes that are either up or down regulated after NELF-RNAi (identified in (E)). Genes that are up-regulated after NELF RNAi (orange and blue) have overall lower nucleosome density around their promoters than genes that are down-regulated (red and green). As seen previously (Gilchrist et al, 2010) genes that are down regulated by NELF RNAi have increased encroachment of nucleosomes over the TSS after NELF RNAi. See Also Figure S3.
Figure 4. Pausing and directionality of RNA polymerase at enhancers
A) A composite profile of TSS-RNA reads (Nech surrounding putative drosophila enhancers as identified by (Kharchenko, Alekseyenko, et al, 2011), n= 533. Data is plotted relative to the DNase hypersensitive site (DHS) site in 25bp bins, and the y- axis is in reads / bin / million reads sequenced. (B) GRO-seq data around the same sites in the presence and absence of sarkosyl, the positive signal (above dotted line) is from the plus stand, the negative signal; the minus strand. (C) GRO-seq data set after RNAi of the pausing factor NELF. (D) Plots of the distribution of orientation indexes for human promoters (green) and enhancers (orange); and drosophila promoters (blue) and enhancers (red). For ease of comparison between promoters and enhancers, the ‘direction’ of the promoter or enhancer is defined by the strand (plus or minus) with the greatest intensity. Thus, the orientation index here will be equal to or greater than 0.5. See Also Figure S4.
Figure 5. Pol II at promoters is predominantly engaged and competent for elongation
(A) Representative browser shot showing Pol II Chip-seq (green) and GRO-seq (red) with Y-axis in reads/bp/10exp6. The regions used for calculating the engaged and competent fraction (ECF) at promoters are indicated below. (B) Schematic explaining the workflow used to calculate the ECF for Pol II at promoters. (C) Histogram showing the distribution of ECF values for significantly bound promoters (n = 3168). The vertical lines represent a 50% (black), the average (red), and the Hsp70 (green) ECFs. Promoters with the lowest ECFs are highlighted in purple. (D) Boxplots showing Pol II ChIP-seq levels at promoters with different ranges of ECF. Promoters with the lowest (purple) and the highest (dark red) ECF values have less Pol II bound at promoters in ChIP-seq experiments than promoters with less extreme ECF values (middle 20% shown), suggesting that the ChIP and GRO discrepancies here could be due to experimental noise. See Also Figure S5.
Similar articles
- Kinetic competition between elongation rate and binding of NELF controls promoter-proximal pausing.
Li J, Liu Y, Rhee HS, Ghosh SK, Bai L, Pugh BF, Gilmour DS. Li J, et al. Mol Cell. 2013 Jun 6;50(5):711-22. doi: 10.1016/j.molcel.2013.05.016. Mol Cell. 2013. PMID: 23746353 Free PMC article. - NELF-mediated stalling of Pol II can enhance gene expression by blocking promoter-proximal nucleosome assembly.
Gilchrist DA, Nechaev S, Lee C, Ghosh SK, Collins JB, Li L, Gilmour DS, Adelman K. Gilchrist DA, et al. Genes Dev. 2008 Jul 15;22(14):1921-33. doi: 10.1101/gad.1643208. Genes Dev. 2008. PMID: 18628398 Free PMC article. - Interactions between DSIF (DRB sensitivity inducing factor), NELF (negative elongation factor), and the Drosophila RNA polymerase II transcription elongation complex.
Missra A, Gilmour DS. Missra A, et al. Proc Natl Acad Sci U S A. 2010 Jun 22;107(25):11301-6. doi: 10.1073/pnas.1000681107. Epub 2010 Jun 4. Proc Natl Acad Sci U S A. 2010. PMID: 20534440 Free PMC article. - Getting up to speed with transcription elongation by RNA polymerase II.
Jonkers I, Lis JT. Jonkers I, et al. Nat Rev Mol Cell Biol. 2015 Mar;16(3):167-77. doi: 10.1038/nrm3953. Epub 2015 Feb 18. Nat Rev Mol Cell Biol. 2015. PMID: 25693130 Free PMC article. Review. - Regulation of snRNA gene expression by the Drosophila melanogaster small nuclear RNA activating protein complex (DmSNAPc).
Hung KH, Stumph WE. Hung KH, et al. Crit Rev Biochem Mol Biol. 2011 Feb;46(1):11-26. doi: 10.3109/10409238.2010.518136. Epub 2010 Oct 6. Crit Rev Biochem Mol Biol. 2011. PMID: 20925482 Review.
Cited by
- Human promoters are intrinsically directional.
Duttke SHC, Lacadie SA, Ibrahim MM, Glass CK, Corcoran DL, Benner C, Heinz S, Kadonaga JT, Ohler U. Duttke SHC, et al. Mol Cell. 2015 Feb 19;57(4):674-684. doi: 10.1016/j.molcel.2014.12.029. Epub 2015 Jan 29. Mol Cell. 2015. PMID: 25639469 Free PMC article. - Genome-wide control of RNA polymerase II activity by cohesin.
Schaaf CA, Kwak H, Koenig A, Misulovin Z, Gohara DW, Watson A, Zhou Y, Lis JT, Dorsett D. Schaaf CA, et al. PLoS Genet. 2013 Mar;9(3):e1003382. doi: 10.1371/journal.pgen.1003382. Epub 2013 Mar 21. PLoS Genet. 2013. PMID: 23555293 Free PMC article. - Transcriptional stalling in B-lymphocytes: a mechanism for antibody diversification and maintenance of genomic integrity.
Sun J, Rothschild G, Pefanis E, Basu U. Sun J, et al. Transcription. 2013 May-Jun;4(3):127-35. doi: 10.4161/trns.24556. Epub 2013 Apr 12. Transcription. 2013. PMID: 23584095 Free PMC article. Review. - The histone variant H2A.Z in yeast is almost exclusively incorporated into the +1 nucleosome in the direction of transcription.
Bagchi DN, Battenhouse AM, Park D, Iyer VR. Bagchi DN, et al. Nucleic Acids Res. 2020 Jan 10;48(1):157-170. doi: 10.1093/nar/gkz1075. Nucleic Acids Res. 2020. PMID: 31722407 Free PMC article. - Transcriptional lockdown during acute proteotoxic stress.
Sawarkar R. Sawarkar R. Trends Biochem Sci. 2022 Aug;47(8):660-672. doi: 10.1016/j.tibs.2022.03.020. Epub 2022 Apr 26. Trends Biochem Sci. 2022. PMID: 35487807 Free PMC article. Review.
References
- Adelman K, Marr MT, Werner J, Saunders A, Ni Z, Andrulis ED, Lis JT. Efficient release from promoter-proximal stall sites requires transcript cleavage factor TFIIS. Mol Cell. 2005;17:103–112. - PubMed
- Baugh LR, Demodena J, Sternberg PW. RNA Pol II accumulates at promoters of growth genes during developmental arrest. Science. 2009;324:92–94. - PubMed
Publication types
MeSH terms
Substances
Grants and funding
- GM25232/GM/NIGMS NIH HHS/United States
- R01 HG004845/HG/NHGRI NIH HHS/United States
- HG004845/HG/NHGRI NIH HHS/United States
- R37 GM025232/GM/NIGMS NIH HHS/United States
- Z01 ES101987/ImNIH/Intramural NIH HHS/United States
- R01 GM025232/GM/NIGMS NIH HHS/United States
LinkOut - more resources
Full Text Sources
Other Literature Sources
Molecular Biology Databases


