Mechanism and functions of membrane binding by the Atg5-Atg12/Atg16 complex during autophagosome formation - PubMed (original) (raw)
Mechanism and functions of membrane binding by the Atg5-Atg12/Atg16 complex during autophagosome formation
Julia Romanov et al. EMBO J. 2012.
Abstract
Autophagy is a conserved process for the bulk degradation of cytoplasmic material. Triggering of autophagy results in the formation of double membrane-bound vesicles termed autophagosomes. The conserved Atg5-Atg12/Atg16 complex is essential for autophagosome formation. Here, we show that the yeast Atg5-Atg12/Atg16 complex directly binds membranes. Membrane binding is mediated by Atg5, inhibited by Atg12 and activated by Atg16. In a fully reconstituted system using giant unilamellar vesicles and recombinant proteins, we reveal that all components of the complex are required for efficient promotion of Atg8 conjugation to phosphatidylethanolamine and are able to assign precise functions to all of its components during this process. In addition, we report that in vitro the Atg5-Atg12/Atg16 complex is able to tether membranes independently of Atg8. Furthermore, we show that membrane binding by Atg5 is downstream of its recruitment to the pre-autophagosomal structure but is essential for autophagy and cytoplasm-to-vacuole transport at a stage preceding Atg8 conjugation and vesicle closure. Our findings provide important insights into the mechanism of action of the Atg5-Atg12/Atg16 complex during autophagosome formation.
Conflict of interest statement
The authors declare that they have no conflict of interest.
Figures
Figure 1
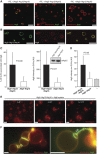
Membrane binding by Atg5–Atg12/Atg16 complex and its components. (A) Coomassie-stained gels showing the results of liposome co-sedimentation assays using Folch liposomes and the indicated proteins. Liposome binding allows the protein to be pelleted. The star indicates a degradation product of the Atg5–Atg12 conjugate. (B, D) Yeast cells of the indicated genotype were transformed with plasmids coding for Atg5–9 × Myc and Atg16–9 × Myc, respectively, and subjected to fractionation experiments. The proteins were detected by anti-Myc western blotting. The presence of the protein in the pellet fraction indicated membrane binding. (C) Quantification showing the relative amounts of Atg5–9 × Myc and Atg5–9 × Myc–Atg12 in the pellet fractions relative to Pex30. The amount of Atg5–9 × Myc and Atg5–9 × Myc–Atg12 in _atg5_Δ cells was set to 1. See Supplementary Figure 1 for graph based on non-normed data. The quantification is based on three independent experiments and the averages and the standard deviations are shown. The numbers next to the blots indicate the molecular weight in kDa. P, pellet; S, supernatant. Figure source data can be found with the Supplementary data.
Figure 2
The lipid requirements for membrane binding by the Atg5–Atg12/Atg16 complex. (A) Coomassie-stained gels of liposome co-sedimentation assays using either Atg5–Atg12/Atg16 (upper panel) or Atg5/Atg16 (lower panel) and liposomes with the indicated lipid composition (Folch: Folch lipids, PE/PI3P: 40% POPC, 35% POPS, 20% POPE, 5% PI3P, PE/PI: 40% POPC, 35% POPS, 20% POPE, 5% PI, DAG/PI3P: 40% POPC, 35% POPS, 20% DAG, 5% PI3P, DAG/PI: 40% POPC, 35% POPS, 20% DAG, 5% PI). Note that the Atg5–Atg12/Atg16 and the Atg5/Atg16 complexes show almost identical binding behaviours. (B) Quantification showing the amounts of Atg5–Atg12/Atg16 and Atg5/Atg16 in the pellet fractions. The amount of protein in the pellet fraction in the absence of liposomes (background) was subtracted from the amount of protein in the pellet fractions in the presence of liposomes. Data were obtained from three independent experiments, one of which is shown in (A). The Atg5–Atg12 and Atg5 bands were used for quantification. (C) Coomassie-stained gel of a liposome co-sedimentation assay showing the lipid requirements of the Atg5–Atg12/Atg16 complex. Liposomes were composed of 40% POPC, 35% POPS, 20% POPE and 5% PI3P. In the liposomes containing no POPE or POPS, these lipids were replaced with POPC. (D) Quantification of Atg5–Atg12/Atg16 in the pellet fraction in liposome co-sedimentation, one of which is shown in (C). Data were obtained from six independent experiments. The Atg5–Atg12 was used for quantification. The average value is shown and the error bars represent the standard deviation. _P_-values were calculated using Student’s _t_-test. The numbers next to the gels indicate the molecular weight in kDa. DAG, diacylglycerol; P, pellet; PI, phosphatidylinositol; PI3P, phosphatidylinositol-3-phosphate; (PO)PC, (1-palmitoyl-2-oleoyl-) phosphatidylcholine; (PO)PE, (1-palmitoyl-2-oleoyl-) phosphatidylethanolamine; (PO)PS, (1-palmitoyl-2-oleoyl-) phosphatidylserine; S, supernatant. Figure source data can be found with the Supplementary data.
Figure 3
Atg3 recruitment to membranes is dependent on Atg16 and Atg12. (A) Coomassie-stained gels showing co-sedimentation assays using Folch liposomes and the indicated proteins. Atg5–Atg12/Atg16 was most efficient in recruiting Atg3 to the pellet fraction. (B) Quantification of Atg3 in the pellet fraction in the presence of the indicated proteins. The quantification is based on three independent experiments. (C) Coomassie-stained gels showing the results of Atg8–PE conjugation assays using the indicated proteins and E. coli lipids derived liposomes. Atg8–PE conjugation was detected as characteristic band shift as the conjugated form runs faster on urea-SDS gels. The numbers above the gels indicate the time in minutes. Note that at least under these conditions almost no Atg8–PE conjugation was detected in the absence of the Atg5–Atg12 conjugate or the Atg5–Atg12/Atg16 complex. The numbers next to the gels indicate the molecular weight in kDa. The averages and the error bars representing the standard deviations are shown. _P_-values were calculated using Student’s _t_-test. NS, non-significant; P, pellet; S, supernatant. Figure source data can be found with the Supplementary data.
Figure 4
Reconstitution of Atg5–Atg12/Atg16 and Atg8 on GUVs. (A) Confocal images showing eGFP–Atg8 recruitment to GUVs is dependent on the Atg5–Atg12/Atg16 complex and PE. The membrane was labelled by incorporation of rhodamine-PE. (B) Single confocal section showing colocalization of Atg5–Atg12/Atg16–eGFP and mCherry–Atg8 on GUVs. (C) Quantification of GUV-associated eGFP–Atg8 in the presence of the Atg5–Atg12/Atg16 complex and the Atg5–Atg12 conjugate. The first graph shows the percentage of GUVs associated with eGFP–Atg8 fluorescence. The second graph shows the intensity of eGFP–Atg8 on the GUVs. The quantification is based on four independent experiments. Inset: anti-Atg12 western blot using the rabbit anti-Atg12 antiserum showing the amounts of Atg5–Atg12/Atg16 complex and Atg5–Atg12 conjugate in one of the assays used for the quantification shown in (C). (D) Quantification of membrane recruitment of Atg3–mCherry by the Atg5–Atg12/Atg16 complex, the Atg5–Atg12 conjugate and a buffer control. The graph is based on two independent experiments. (E) Widefield images showing individual frames of a time series of GUVs incubated with Atg3, Atg7, Atg8 and the Atg5–Atg12/Atg16 complex (see Materials and methods for details). The membrane was labelled by incorporation of rhodamine-PE. The time is indicated in minutes. (F) Widefield images of GUVs incubated with Atg3, Atg7, eGFP–Atg8 and the Atg5–Atg12/Atg16 complex for 35 min (left) or 70 min (right). The membrane was labelled by incorporation of rhodamine-PE. Note the massive accumulation of eGFP–Atg8 at the interface between individual GUVs. The arrows point to some of these interfaces. For the quantifications, the averages and standard deviations are shown. _P_-values were calculated using Student’s _t_-test. Scale bars: 10 μm. Figure source data can be found with the Supplementary data.
Figure 5
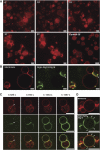
Membrane tethering by the Atg5–Atg12/Atg16 complex. (A) Frames of widefield images taken from a time series of rhodamine-PE labelled GUVs in the presence of the Atg5–Atg12/Atg16 complex. For the control condition buffer but no protein was added. Note the increase in clustered GUVs over time. The numbers indicate the time in minutes. (B) Confocal images of rhodamine-PE labelled GUVs incubated with Atg5–Atg12/Atg16–eGFP complex. Note the accumulation of the complex at the interface between GUVs (arrows). (C) Individual confocal frames of a time series of rhodamine-PE labelled GUVs incubated with Atg5–Atg12/Atg16–eGFP. The arrows point to the GUV–GUV interface where the protein initially accumulated. (D) Confocal images of rhodamine-PE labelled GUVs incubated with Atg5–Atg12/Atg16–eGFP. The arrows point to the concentrations of Atg5–Atg12/Atg16 on the GUV membrane. Scale bars: 10 μm (A–C) and 3 μm (D).
Figure 6
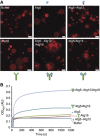
Membrane tethering is Atg16 dependent. (A) Widefield images of rhodamine-PE labelled GUVs 30 min after incubation with the indicated proteins. Note that GUVs cluster only in the presence of the Atg5–Atg12/Atg16 and Atg5/Atg16 complexes. (B) SUV aggregation assay using Folch liposomes and the indicated proteins. The proteins were added after a short delay. The symbols above, below the images or next to the curves represent Atg5 (blue oval), Atg12 (red circle) and Atg16 (green Y). The overall shape of the Atg5–Atg12/Atg16 complex is according to the structural model of the complex as proposed in Fujioka et al (2010). Scale bars: 10 μm.
Figure 7
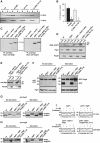
Membrane binding by Atg5 is essential for autophagy and the Cvt pathway in vivo. (A) Liposome co-sedimentation assay using Folch liposomes and the indicated Atg5 proteins stabilized with an N-terminal fragment of Atg16 (amino acids 1–46). (B) Quantification based on three co-sedimentation assays as shown in (A). The amount of protein pelleted in the absence of liposomes was subtracted. The averages and the standard deviations are shown. (C) Yeast cells were transformed with the indicated expression constructs and Atg5–2 × Myc was immunoprecipitated with an anti-Myc antibody. The precipitated protein was subjected to anti-Atg5 and anti-Atg12 western blotting. The substitution of R171 and K160 to glutamate caused the mutant protein to run higher. The same phenomenon was observed for the recombinant protein (Supplementary Figure 3). (D) Anti-Atg12 western blot of cell fractions prepared from rapamycin-treated yeast cells. The anti-Pgk1 and anti-Pex30 served as control for the cytosolic and membrane fractions, respectively. (E) Anti-Myc and anti-Pex30 western blots of yeast cell fractions from cells of the indicated genotype and expressing Atg16–9 × Myc and Atg5 or Atg5 K160E, R171E. (F) Starvation assay with the indicated yeast strains and the indicated rescue constructs. GFP was detected by western blotting. Pgk1 served as loading control. (G) Same assay as shown in (F) but using an anti-Ape1 antiserum for western blotting. (H) Western blots of yeast cell lysates using an anti-Atg8 antiserum. (I) Ape1 protease protection assay with the indicated yeast strains. The percentages below the blots indicate the percent of protected ApeI in the +protease K, −Triton X-100 lanes and are the average of three independent experiments±the standard deviation. The numbers next to the blots indicate the molecular weight in kDa. Figure source data can be found with the Supplementary data.
Figure 8
Localization of wild-type Atg5 and Atg5 K160E, R171E to the PAS. (A) Yeast cells of the indicated genotype expressing Atg5–3 × mCherry or Atg5 K160E, R171E–3 × mCherry were treated with rapamycin and imaged using a Deltavision microscope. Maximum projections of z-stacks are shown. (B) Graph showing the percentage of mCherry-positive cells that display Atg5–3 × mCherry dots. In total, 3 independent experiments were conducted and >400 cells were counted. (C) Graph showing the percentage of cells that display Atg16–3 × mCherry dots. In total, 3 independent experiments were conducted and >750 cells were counted. The graphs show the averages and the error bars representing the standard deviations. _P_-values were calculated using Student’s _t_-test. Scale bars: 5 μm.
Similar articles
- Dissecting the role of the Atg12-Atg5-Atg16 complex during autophagosome formation.
Walczak M, Martens S. Walczak M, et al. Autophagy. 2013 Mar;9(3):424-5. doi: 10.4161/auto.22931. Epub 2013 Jan 15. Autophagy. 2013. PMID: 23321721 Free PMC article. - Molecular mechanism of autophagic membrane-scaffold assembly and disassembly.
Kaufmann A, Beier V, Franquelim HG, Wollert T. Kaufmann A, et al. Cell. 2014 Jan 30;156(3):469-81. doi: 10.1016/j.cell.2013.12.022. Cell. 2014. PMID: 24485455 - Two distinct mechanisms target the autophagy-related E3 complex to the pre-autophagosomal structure.
Harada K, Kotani T, Kirisako H, Sakoh-Nakatogawa M, Oikawa Y, Kimura Y, Hirano H, Yamamoto H, Ohsumi Y, Nakatogawa H. Harada K, et al. Elife. 2019 Feb 27;8:e43088. doi: 10.7554/eLife.43088. Elife. 2019. PMID: 30810528 Free PMC article. - Beyond Atg8 binding: The role of AIM/LIR motifs in autophagy.
Fracchiolla D, Sawa-Makarska J, Martens S. Fracchiolla D, et al. Autophagy. 2017 May 4;13(5):978-979. doi: 10.1080/15548627.2016.1277311. Epub 2017 Jan 25. Autophagy. 2017. PMID: 28121222 Free PMC article. Review. - Autophagosomes are formed at a distinct cellular structure.
Hollenstein DM, Kraft C. Hollenstein DM, et al. Curr Opin Cell Biol. 2020 Aug;65:50-57. doi: 10.1016/j.ceb.2020.02.012. Epub 2020 Mar 20. Curr Opin Cell Biol. 2020. PMID: 32203894 Free PMC article. Review.
Cited by
- BRF1 promotes the odontogenic differentiation of dental pulp stem cells in pulpitis by inducing autophagy.
Zhou C, Wu Y, Teng Y, Zhang J, Liu J. Zhou C, et al. Heliyon. 2024 Jul 30;10(16):e35442. doi: 10.1016/j.heliyon.2024.e35442. eCollection 2024 Aug 30. Heliyon. 2024. PMID: 39229529 Free PMC article. - Mitochondrial membrane proteins and VPS35 orchestrate selective removal of mtDNA.
Sen A, Kallabis S, Gaedke F, Jüngst C, Boix J, Nüchel J, Maliphol K, Hofmann J, Schauss AC, Krüger M, Wiesner RJ, Pla-Martín D. Sen A, et al. Nat Commun. 2022 Nov 7;13(1):6704. doi: 10.1038/s41467-022-34205-9. Nat Commun. 2022. PMID: 36344526 Free PMC article. - Interferon-induced GTPases orchestrate host cell-autonomous defence against bacterial pathogens.
Rafeld HL, Kolanus W, van Driel IR, Hartland EL. Rafeld HL, et al. Biochem Soc Trans. 2021 Jun 30;49(3):1287-1297. doi: 10.1042/BST20200900. Biochem Soc Trans. 2021. PMID: 34003245 Free PMC article. Review. - Autophagy-independent induction of LC3B through oxidative stress reveals its non-canonical role in anoikis of ovarian cancer cells.
Satyavarapu EM, Das R, Mandal C, Mukhopadhyay A, Mandal C. Satyavarapu EM, et al. Cell Death Dis. 2018 Sep 17;9(10):934. doi: 10.1038/s41419-018-0989-8. Cell Death Dis. 2018. PMID: 30224639 Free PMC article. Retracted. - The Interplay between Autophagy and Virus Pathogenesis-The Significance of Autophagy in Viral Hepatitis and Viral Hemorrhagic Fevers.
Bębnowska D, Niedźwiedzka-Rystwej P. Bębnowska D, et al. Cells. 2022 Mar 3;11(5):871. doi: 10.3390/cells11050871. Cells. 2022. PMID: 35269494 Free PMC article. Review.
References
- Chernomordik LV, Kozlov MM (2005) Membrane hemifusion: crossing a chasm in two leaps. Cell 123: 375–382 - PubMed
Publication types
MeSH terms
Substances
LinkOut - more resources
Full Text Sources
Other Literature Sources
Molecular Biology Databases


