Input-specific control of reward and aversion in the ventral tegmental area - PubMed (original) (raw)
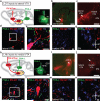
Figure 1. LDT and LHb preferentially project to distinct VTA subregions
a, Injection sites for RV-tdTomato in NAc and PHA-L in LDT. Image shows PHA-L staining in LDT (4V: fourth ventricle). b, RV-tdTomato in NAc lateral shell. c, VTA neurons projecting to NAc lateral shell are mainly located in lateral VTA (IPN: interpeduncular nucleus) (a-c scale bars, 200 μm). d,e, PHA-L labeled terminals (green) from LDT are adjacent to cells projecting to NAc lateral shell (red) as well as TH-immunopositive processes (blue). f, g, Few PHA-L labeled terminals were detected in medial VTA (f) and in SN (g) (d-g scale bars, 20 μm). h, Injection sites for RV-tdTomato in mPFC and PHA-L in LHb. Image shows PHA-L staining in LHb (MHb: medial habenula; D3V: dorsal third ventricle). i, RV-tdTomato in mPFC. j, VTA neurons projecting to mPFC are mainly located in medial VTA (h-j scale bars, 200 μm). k, l, PHA-L labeled terminals (green) from LHb are found adjacent to cells projecting to mPFC (red) as well as TH-immunopositive processes (blue). m, n, Few PHA-L labeled terminals were detected in lateral VTA (m) and in SN (n) (k-n scale bars, 20 μm).
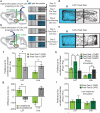
Figure 2. Stimulation of LDT and LHb inputs to VTA elicits CPP and CPA
a,b, RV-ChR2 injection into VTA and optical stimulation of (a) LDT- and (b) LHb projection neurons. c, Procedure to elicit and test CPP and CPA. d,e, Example day 3 mouse tracks, Post-Test 1. Arrow indicates chamber in which (d) LDT or (e) LHb projection neurons were stimulated on Day 2. f, Ratio from Post-Test1/Pre-Test of time spent in conditioned chamber was higher in LDT-ChR2 mice compared to LDT-EGFP mice (LDT-ChR2: 1.32 ± 0.1, n=8; LDT-EGFP: 0.96 ± 0.13, n=7) but lower in LHb-ChR2 mice (LHb-ChR2: 0.76 ± 0.06, n=9; LHb-EGFP: 0.99 ± 0.08, n=11). g, Differences between Post-Test 1 and Pre-Test in time mice spent in conditioned or unconditioned chambers. (LDT-ChR2 mice: conditioned chamber: 105.4 ± 34.38, n=8; unconditioned chamber: -51.1 ± 26.76, n=8) (LHb-ChR2 mice: cond. chamber: -90.87 ± 22.59, n=9; unconditioned chamber: 124.3 ± 26.27, n=9). h, Stimulation of LDT-ChR2 mice during Post-Test 2 enhanced preference for conditioned chamber (LDT-ChR2 Post-Test 1, 1.32 ± 0.1, n=8; Post-Test 2, 1.85 ± 0.2, n=8; Post-Test 2 LDT-EGFP mice 1.13±0.16, n=7). Stimulation of LHb-Chr2 mice during Post-Test 2 did not cause further aversion (LHb-ChR2 Post-Test 1, 0.76 ± 0.06, n=9; Post-Test 2, 0.85±0.08, n=9) which was still present (LHb-EGFP Post-Test 2, 1.22±0.16, n=11). (Post-test 1 results are same as in f). i, Low frequency stimulation of LDT-ChR2 and LHb-ChR2 cells did not elicit CPP or CPA (Post-Test 1, LDT-ChR2, 1.13 ± 0.09, n=6; Post-Test 2, LDT-ChR2, 1.28 ± 0.26, n=6; Post-Test 1, LHb-ChR2, 0.97 ± 0.14, n=7; Post-Test 2, LHb-ChR2, 1.14 ± 0.17, n=6). Error bars denote s.e.m. *p<0.05; **p<0.01; ***p<0.001, Mann-Whitney U-test.
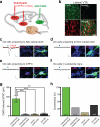
Figure 3. LDT neurons preferentially synapse on DA neurons projecting to NAc lateral shell
a, AAV-ChR2-EYFP injected into LDT and retrobeads injected into NAc lateral shell and NAc medial shell or in mPFC. b, ChR2-EYFP expression in close proximity to retrogradely labeled (beads) TH-immunopositive neurons in lateral VTA (scale bar, 50 μm). c-f, Traces from whole-cell recordings at -70 mV showing EPSCs generated by stimulation of LTD inputs in retrogradely labeled VTA neurons (beads) projecting to (c) NAc lateral shell, (d) NAc medial shell, (e) mPFC or (f) SN neurons. All cells were filled with neurobiotin (NB, green) and are TH-immunopositive (blue). Scale bars: 20 pA/20 ms. g, Summary of average EPSCs generated by optical stimulation of LDT inputs in the four cell populations ( **p<0.01, ***p<0.001, 1 way ANOVA with Bonferroni post-hoc test; Error bars denote s.e.m.). **h**, Percentage of cells in which optical stimulation generated EPSCs >10 pA. N's shown within each bar also apply to g.
Figure 4. LHb neurons preferentially synapse on DA neurons projecting to mPFC and RMTg GABAergic neurons
a, AAV-ChR2-EYFP injected into LHb and retrobeads injected either into NAc lateral shell and NAc medial shell or in mPFC. b-e, Traces from whole-cell recordings at -70 mV showing EPSCs generated by optical stimulation of LHb inputs in retrogradely labeled VTA neurons (beads, red) projecting to (b) mPFC or (c) NAc lateral shell or (d) an RMTg cell and (e) SN cell. All cells were filled with neurobiotin (NB, green) and are either TH-immunopositive (blue) (b, c, e) or GAD67-immunopositive (blue, d). Scale bars: 20 pA/20 ms. f, Summary of average EPSCs generated by optical stimulation of LHb inputs in five cell populations ( **p<0.01, ***p<0.001, 1 way ANOVA with Bonferroni post-hoc test, error bars denote s.e.m.). **g**, Percentage of cells in which optical stimulation generated EPSCs >10 pA. N's shown in this graph also apply to f. h, Optical stimulation of LHb inputs generates IPSC in DA cell projecting to NAc lateral shell (PCTX, picrotoxin) (scale bars, 20 pA/20 ms). Graph shows percentage of DA cells projecting to NAc lateral shell or medial shell in which IPSCs were generated by LHb input stimulation. i, Average IPSC size from DA cells projecting to NAc lateral shell. IPSCs were blocked by picrotoxin (n=3; ***p<0.0001, unpaired Student's t-test).
Figure 5. Rabies virus reveals distinct VTA circuits and effects of DA receptor antagonists on CPP/CPA
a, AAV expressing rabies glycoprotein (RVG) in a Cre-dependent manner was injected into VTA of TH-Cre mice. RV-EGFP and RV-tdTomato, injected subsequently into mPFC and NAc, respectively, are retrogradely transported to subpopulations of DA neuron in which transcomplementation occurs, allowing RV to spread retrogradely and label cells that synaptically contact infected DA neurons. b, Injection sites in NAc lateral shell (RV-tdTomato) and mPFC (RV-EGFP) (scale bars, 200 μm). c, TH-immunoreactive neurons in VTA retrogradely labeled by RV-tdTomato or RV-EGFP (scale bars, 20 μm). d,e tdTomato and EGFP labeling in LDT (d) and LHb (e) neurons, respectively, when injection of AAV-DIO-RVG into VTA of TH-Cre mice was performed prior to RV injections (DTg, dorsal tegmental nucleus; Aq, aqueduct; MHb, medial habenula; D3V, dorsal third ventricle; Th, thalamus) (d, e scale bars, 100 μm). f,g, Lack of tdTomato expression in LDT (f) and lack of EGFP expression in LHb (g) following RV injections in TH-Cre mice that were not injected with AAV-DIO-RVG (f, g scale bars, 100 μm). h, Placements of drug infusion cannula into mPFC and optic fiber into LHb as well as injection of RV-ChR2 into VTA. i, Ratio of Post-Test/Pre-Test time spent in conditioned chamber when SCH23390 (SCH) or vehicle was infused into mPFC prior to LHb optical stimulation (SCH: 0.95 ± 0.05, n=9; vehicle: 0.75 ± 0.04, n=7). j, Difference between Post-Test and Pre-Test in time mice spent in conditioned or unconditioned chambers following LHb stimulation (SCH: conditioned chamber, -7.24 ± 28.79, unconditioned chamber: 36.83 ± 30.74, n=9; vehicle: conditioned chamber, -106.88 ± 18.82, unconditioned chamber, 112.61 ± 26.48, n=7). k, Placements of drug infusion cannula into NAc lateral shell and optic fiber into LDT as well as injection of RV-ChR2 into VTA. l, Ratio of Post-Test /Pre-Test time spent in conditioned chamber when SCH23390 and raclopride (rac) or vehicle were infused into NAc lateral shell prior to LDT optical stimulation (SCH/rac: 0.89 ± 0.1, n=7; vehicle:1.26 ± 0.08, n=6). m, Difference between Post-Test and Pre-Test in time mice spent in conditioned or unconditioned chamber following LDT stimulation (SCH/rac: conditioned chamber: -30.17 ± 37.38, unconditioned chamber: 42.22 ± 34.68, n=7; vehicle: conditioned chamber: 94.58 ± 27.77, unconditioned chamber, -59.38 ± 26.44, n=6) *p<0.05, **p<0.01, ***p<0.001, Mann-Whitney U-test. Error bars denote s.e.m. n, Hypothesized circuits driven by LDT and LHb inputs into the VTA. Green shading indicates circuit involved in aversion; red/pink shading indicates circuit involved in reward and salience.


