Reference intervals for plasma free metanephrines with an age adjustment for normetanephrine for optimized laboratory testing of phaeochromocytoma - PubMed (original) (raw)
. 2013 Jan;50(Pt 1):62-9.
doi: 10.1258/acb.2012.012066. Epub 2012 Oct 12.
Peter Lattke, Maria Herberg, Gabriele Siegert, Nan Qin, Roland Därr, Jana Hoyer, Arno Villringer, Aleksander Prejbisz, Andrzej Januszewicz, Alan Remaley, Victoria Martucci, Karel Pacak, H Alec Ross, Fred C G J Sweep, Jacques W M Lenders
Affiliations
- PMID: 23065528
- PMCID: PMC4714582
- DOI: 10.1258/acb.2012.012066
Reference intervals for plasma free metanephrines with an age adjustment for normetanephrine for optimized laboratory testing of phaeochromocytoma
Graeme Eisenhofer et al. Ann Clin Biochem. 2013 Jan.
Abstract
Background: Measurements of plasma normetanephrine and metanephrine provide a useful diagnostic test for phaeochromocytoma, but this depends on appropriate reference intervals. Upper cut-offs set too high compromise diagnostic sensitivity, whereas set too low, false-positives are a problem. This study aimed to establish optimal reference intervals for plasma normetanephrine and metanephrine.
Methods: Blood samples were collected in the supine position from 1226 subjects, aged 5-84 y, including 116 children, 575 normotensive and hypertensive adults and 535 patients in whom phaeochromocytoma was ruled out. Reference intervals were examined according to age and gender. Various models were examined to optimize upper cut-offs according to estimates of diagnostic sensitivity and specificity in a separate validation group of 3888 patients tested for phaeochromocytoma, including 558 with confirmed disease.
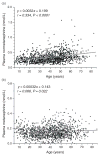
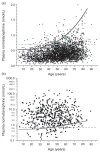
Results: Plasma metanephrine, but not normetanephrine, was higher (P < 0.001) in men than in women, but reference intervals did not differ. Age showed a positive relationship (P < 0.0001) with plasma normetanephrine and a weaker relationship (P = 0.021) with metanephrine. Upper cut-offs of reference intervals for normetanephrine increased from 0.47 nmol/L in children to 1.05 nmol/L in subjects over 60 y. A curvilinear model for age-adjusted compared with fixed upper cut-offs for normetanephrine, together with a higher cut-off for metanephrine (0.45 versus 0.32 nmol/L), resulted in a substantial gain in diagnostic specificity from 88.3% to 96.0% with minimal loss in diagnostic sensitivity from 93.9% to 93.6%.
Conclusions: These data establish age-adjusted cut-offs of reference intervals for plasma normetanephrine and optimized cut-offs for metanephrine useful for minimizing false-positive results.
Conflict of interest statement
Competing interests: None.
Figures
Figure 1
Scatter plots showing relationships of age with plasma concentrations of normetanephrine (a) and metanephrine (b) for subjects of the reference population (n = 1226)
Figure 2
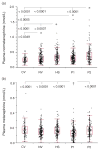
Box plots showing distributions of plasma concentrations of normetanephrine (a) and metanephrine (b) among the five subgroups of the reference population. CV, child volunteers; NV, normotensive heathy volunteers; HS, hypertensive subjects; P1, patient group 1 (tested for phaeochromocytoma because of an incidental mass found on imaging, an underlying germline mutation or a previous history of the tumour); P2, patient group 2 (tested for phaeochromocytoma because of signs and symptoms of catecholamine excess). *†Indicates groups with higher* and lower† concentrations than other connected groups at the indicated levels of significance
Figure 3
Scatter plots showing relationships of age with plasma concentrations of normetanephrine for patients of the validation population without (a) and with (b) phaeochromocytoma. The dashed horizontal lines serve to illustrate the static age-unadjusted upper cut-off for plasma normetanephrine (0.706 nmol/L) determined from the 97.5 percentiles of the combined reference population (Table 2). The curved line serves to illustrate age-adjusted cut-offs for plasma normetanephrine (UCNMN) according to the equation, UCNMN = 2.074 × 10⁻⁶age3 + 0.540, established for the curvilinear model. Note that for patients with phaeochromocytoma (b), data for plasma normetanephrine are plotted using a logarithmic scale
Similar articles
- Biochemical diagnosis of phaeochromocytoma using plasma-free normetanephrine, metanephrine and methoxytyramine: importance of supine sampling under fasting conditions.
Därr R, Pamporaki C, Peitzsch M, Miehle K, Prejbisz A, Peczkowska M, Weismann D, Beuschlein F, Sinnott R, Bornstein SR, Neumann HP, Januszewicz A, Lenders J, Eisenhofer G. Därr R, et al. Clin Endocrinol (Oxf). 2014 Apr;80(4):478-86. doi: 10.1111/cen.12327. Epub 2013 Oct 17. Clin Endocrinol (Oxf). 2014. PMID: 24102244 Clinical Trial. - Plasma-free vs deconjugated metanephrines for diagnosis of phaeochromocytoma.
Pamporaki C, Därr R, Bursztyn M, Glöckner S, Bornstein SR, Lenders JW, Pacak K, Krinner A, Eisenhofer G. Pamporaki C, et al. Clin Endocrinol (Oxf). 2013 Oct;79(4):476-83. doi: 10.1111/cen.12191. Epub 2013 Apr 17. Clin Endocrinol (Oxf). 2013. PMID: 23461656 Free PMC article. - Screening for phaeochromocytoma and paraganglioma: impact of using supine reference intervals for plasma metanephrines with samples collected from fasted/seated patients.
Casey R, Griffin TP, Wall D, Dennedy MC, Bell M, O'Shea PM. Casey R, et al. Ann Clin Biochem. 2017 Jan;54(1):170-173. doi: 10.1177/0004563216646395. Epub 2016 Sep 28. Ann Clin Biochem. 2017. PMID: 27166307 - [Plasma metanephrine measurements make the diagnosis of pheochromocytoma easier].
Friberg P. Friberg P. Lakartidningen. 1998 May 20;95(21):2482-5. Lakartidningen. 1998. PMID: 9640923 Review. Swedish. - Laboratory evaluation of pheochromocytoma and paraganglioma.
Eisenhofer G, Peitzsch M. Eisenhofer G, et al. Clin Chem. 2014 Dec;60(12):1486-99. doi: 10.1373/clinchem.2014.224832. Epub 2014 Oct 20. Clin Chem. 2014. PMID: 25332315 Review.
Cited by
- Pheochromocytoma and paraganglioma: diagnosis, genetics, management, and treatment.
Martucci VL, Pacak K. Martucci VL, et al. Curr Probl Cancer. 2014 Jan-Feb;38(1):7-41. doi: 10.1016/j.currproblcancer.2014.01.001. Epub 2014 Jan 15. Curr Probl Cancer. 2014. PMID: 24636754 Free PMC article. Review. No abstract available. - Urinary and plasma catecholamines and metanephrines in dogs with pheochromocytoma, hypercortisolism, nonadrenal disease and in healthy dogs.
Salesov E, Boretti FS, Sieber-Ruckstuhl NS, Rentsch KM, Riond B, Hofmann-Lehmann R, Kircher PR, Grouzmann E, Reusch CE. Salesov E, et al. J Vet Intern Med. 2015 Mar-Apr;29(2):597-602. doi: 10.1111/jvim.12569. J Vet Intern Med. 2015. PMID: 25818214 Free PMC article. - Measurements of Plasma-Free Metanephrines by Immunoassay Versus Urinary Metanephrines and Catecholamines by Liquid Chromatography with Amperometric Detection for the Diagnosis of Pheochromocytoma/Paraganglioma.
Raber W, Kotal H, Marculescu R, Scheuba C, Niederle MB, Kautzky-Willer A, Krebs M. Raber W, et al. J Clin Med. 2020 Sep 26;9(10):3108. doi: 10.3390/jcm9103108. J Clin Med. 2020. PMID: 32993074 Free PMC article. - Editorial: Predictive tools in pheochromocytoma and paraganglioma.
Ceccato F, Correa R, Livhits M, Falhammar H. Ceccato F, et al. Front Endocrinol (Lausanne). 2023 Jun 13;14:1227543. doi: 10.3389/fendo.2023.1227543. eCollection 2023. Front Endocrinol (Lausanne). 2023. PMID: 37383393 Free PMC article. No abstract available. - Mass spectrometric quantification of salivary metanephrines-A study in healthy subjects.
Osinga TE, van der Horst-Schrivers AN, van Faassen M, Kerstens MN, Dullaart RP, Pacak K, Links TP, Kema IP. Osinga TE, et al. Clin Biochem. 2016 Sep;49(13-14):983-8. doi: 10.1016/j.clinbiochem.2016.02.003. Epub 2016 Feb 10. Clin Biochem. 2016. PMID: 26874200 Free PMC article.
References
- Pacak K, Eisenhofer G, Ahlman H, et al. Pheochromocytoma: recommendations for clinical practice from the First International Symposium. Nat Clin Pract Endocrinol Metab. 2007;3:92–102. - PubMed
- Peaston RT, Ball S. Biochemical detection of phaeochromocytoma: why are we continuing to ignore the evidence? Ann Clin Biochem. 2008;45:6–10. - PubMed
- Eisenhofer G. Screening for pheochromocytomas and paragangliomas. Curr Hypertens Rep. 2012;14:130–7. - PubMed
- Eisenhofer G, Keiser H, Friberg P, et al. Plasma metanephrines are markers of pheochromocytoma produced by catechol-O-methyltransferase within tumors. J Clin Endocrinol Metab. 1998;83:2175–85. - PubMed
Publication types
MeSH terms
Substances
LinkOut - more resources
Full Text Sources
Other Literature Sources
Medical


