Histone variant macroH2A marks embryonic differentiation in vivo and acts as an epigenetic barrier to induced pluripotency - PubMed (original) (raw)
. 2012 Dec 15;125(Pt 24):6094-104.
doi: 10.1242/jcs.113019. Epub 2012 Oct 17.
Affiliations
- PMID: 23077180
- PMCID: PMC3585521
- DOI: 10.1242/jcs.113019
Histone variant macroH2A marks embryonic differentiation in vivo and acts as an epigenetic barrier to induced pluripotency
Vincent Pasque et al. J Cell Sci. 2012.
Abstract
How cell fate becomes restricted during somatic cell differentiation is a long-lasting question in biology. Epigenetic mechanisms not present in pluripotent cells and acquired during embryonic development are expected to stabilize the differentiated state of somatic cells and thereby restrict their ability to convert to another fate. The histone variant macroH2A acts as a component of an epigenetic multilayer that heritably maintains the silent X chromosome and has been shown to restrict tumor development. Here we show that macroH2A marks the differentiated cell state during mouse embryogenesis. MacroH2A.1 was found to be present at low levels upon the establishment of pluripotency in the inner cell mass and epiblast, but it was highly enriched in the trophectoderm and differentiated somatic cells later in mouse development. Chromatin immunoprecipitation revealed that macroH2A.1 is incorporated in the chromatin of regulatory regions of pluripotency genes in somatic cells such as mouse embryonic fibroblasts and adult neural stem cells, but not in embryonic stem cells. Removal of macroH2A.1, macroH2A.2 or both increased the efficiency of induced pluripotency up to 25-fold. The obtained induced pluripotent stem cells reactivated pluripotency genes, silenced retroviral transgenes and contributed to chimeras. In addition, overexpression of macroH2A isoforms prevented efficient reprogramming of epiblast stem cells to naïve pluripotency. In summary, our study identifies for the first time a link between an epigenetic mark and cell fate restriction during somatic cell differentiation, which helps to maintain cell identity and antagonizes induction of a pluripotent stem cell state.
Figures
Fig. 1.
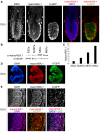
MacroH2A.1 is downregulated in the naïve pluripotent epiblast. (A) E3.5 female mouse blastocyst wholemount immunofluorescence against macroH2A.1 (red in merge panel), Oct4 (blue in merge panel) and Nanog (green in merge panel). Nuclear macroH2A.1 is detected at equivalent levels in cells of the trophectoderm and those of the ICM (dashed lines). Note that naïve pluripotency has not been established in the ICM at this stage. Images are projected confocal Z-sections. (B) E4.5 female mouse blastocyst wholemount immunofluorescence against macroH2A.1 (red in merge panel), Oct4 (blue in merge panel) and Nanog (green in merge panel). Nuclear macroH2A.1 is detected at higher levels in cells of the trophectoderm, and is downregulated in cells of the ICM (dashed line), and this is at a stage when naïve pluripotency has been established. Images are projected confocal Z-sections.
Fig. 2.
MacroH2A.1 becomes highly expressed during somatic lineage development. (A) E6.5 female X-GFP mouse conceptus wholemount immunofluorescence against macroH2A.1 (red in merge panel) and GFP (green in merge panel). MacroH2A.1 is highly expressed in the visceral endoderm (VE) and to some extent in the extra embryonic ectoderm (TE) but is not detected in the epiblast (EPI), precursor of all somatic lineages (mosaic X-GFP expression due to random X chromosome inactivation). DAPI is in blue. Images are projected confocal Z-sections. (B) Western blot analysis of macroH2A.1 in ESCs, EpiSCs, NSCs and MEFs. All cells are female. Tubulin was used as a loading control. (C) Quantification of western blot analysis shown in B. MacroH2A.1 signal was normalized to tubulin and ESCs levels set to 1. MacroH2A.1 expression is lowest in ESCs and increases with the differentiated state in EpiSCs, MEFs and adult NSCs. (D) E9.5 female X-GFP mouse embryo wholemount immunofluorescence against macroH2A.1 (red) and GFP (green). MacroH2A.1 is expressed throughout all tissues of the embryo at this stage. DAPI is in blue. Images acquired using epifluorescence microscopy. (E) E9.5 X-GFP mouse embryo immunofluorescence against macroH2A.1 (red) and GFP (green) showing a portion of the lateral plate mesoderm (including somites). Nuclear macroH2A.1 is detected in all somatic cells. Mosaic X-GFP expression is due to random X chromosome inactivation. DAPI is in blue. Images are projected confocal Z-sections. Scale bars: 20 µm.
Fig. 3.
MacroH2A.1 marks chromatin of regulatory sequences of repressed pluripotency genes in differentiated cells. MacroH2A.1 ChIP analysis of pluripotent and lineage-specific gene regulatory regions in pluripotent (ESCs, light gray), and somatic cells (NSCs, gray; MEFs, dark gray). DE, distal enhancer; PE, proximal enhancer; PP, proximal promoter; RR1, regulatory region 1; RR2, regulatory region 2. Error bars depict the s.e.m. (n = 3). There were significant differences between ESCs and NSCs or MEFs, as indicated; *P<0.05; _t_-test one tail, type 3.
Fig. 4.
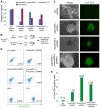
MacroH2A acts as a barrier to somatic cell reprogramming to pluripotency. (A) qRT-PCR analysis of macroH2A.1 (blue) and macroH2A.2 (purple) expression in Oct4-GFP NSCs stably expressing Scr shRNA, macroH2A.1 shRNA, macroH2A.2 shRNA or both macroH2A.1 and macroH2A.2 shRNAs. Error bars indicate s.d. (B) Diagram showing the experimental set up. Stable Oct4-GFP NSCs lines expressing shRNAs against macroH2A.1, macroH2A.2 or both macroH2A.1 and macroH2A.2, or control scrambled sequence (Scr), were generated and induced to reprogram following retroviral-mediated Oct4 and Klf4 expression under serum and LIF culture conditions from 3 days after factor expression. (C) MacroH2A depletion improves the efficiency of reprogramming to pluripotency. Oct4-GFP-positive colonies obtained from expression of Oct4 and Klf4 in macroH2A shRNA Oct4-GFP NSCs cultured with serum and LIF in the absence of 2i. Note that no Oct4-GFP colonies were obtained from shRNA-expressing cells induced to reprogram within the experimental time frame. Images were taken 24 days following retroviral pluripotency gene expression. (D) Flow cytometry analysis of reprogramming cultures. The proportion of Oct4-GFP-positive cells 24 days after the induction of nuclear reprogramming is indicated (% total cells). Oct4-GFP NSCs and Oct4-GFP ESCs were used as controls. Results are representative of two experiments. (E) Reprogramming efficiency as judged by the proportion of Oct4-GFP-positive cells.
Fig. 5.
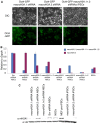
MacroH2A knockdown is maintained in the obtained iPSCs. (A) Morphology of the iPSCs obtained from reprogrammed macroH2A-depleted NSCs. (B) qRT-PCR analysis of macroH2A.1 and macroH2A.2 expression in NSCs, ESCs and iPSCs derived from macroH2A.1- or macroH2A.2-depleted NSCs. MacroH2A.1 (macroH2A.1.1 + macroH2A.1.2) is in blue, macroH2A.2 is in purple. Error bars indicate s.d. (C) Western blot analysis of macroH2A.1 in shRNA NSCs and macroH2A shRNA iPSCs. Histone H3 was used as a loading control.
Fig. 6.
Characterization of macroH2A-depleted iPSCs. (A) qRT-PCR analysis of retrovirus expression in NSCs, NS Pre-iPSCs and in iPSCs derived from macroH2A.1 or macroH2A.2 NSCs. Klf4 retrovirus (RetrKlf4) is in blue and Oct4 retrovirus (RetrOct4) in red. (B) Gene expression analysis of the iPSCs depleted of macroH2A. qRT-PCR analysis of pluripotency gene expression in NSCs, ESCs and iPSCs derived from macroH2A.1 or macroH2A.2 NSCs. Endogenous Oct4 (EndOct4) is in blue, Rex1 in red, Klf4 in purple and Nanog in green. (C) Tissues of the three embryonic germ layers are present in the teratomas derived from macroH2A.2 shRNA expressing iPSCs. (D) Contribution of macroH2A-depleted iPSCs to chimeric mice. These were obtained after blastocyst injection of macroH2A shRNA iPSCs into C57/BL6 blastocysts. Agouti coat color indicates chimerism (arrows). Error bars indicate s.d.
Fig. 7.
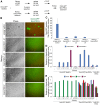
MacroH2A overexpression prevents efficient reprogramming of EpiSC to naïve pluripotency. (A) Diagram showing the experimental set up. Oct4-GFP EpiSCs were transfected with vectors encoding Nanog in combination with macroH2A.1.s1, macroH2A.1.s2, macroH2A.1.s4, macroH2A.2 or empty vector control and grown for 2 weeks under dual selection. Selected cells were plated at a density of 50,000 cells per well of a six-well plate, switched to 2i plus LIF the next day and cultured for another 9 days before monitoring the presence of reprogrammed Oct4-GFP-positive Epi-iPSCs. (B) Representative phase and GFP images taken 9 days after the 2i plus LIF culture of Oct4-GFP EpiSC with Nanog and macroH2A variants or empty vector overexpression. (C) Oct4-GFP-positive Epi-iPSCs colony counts. The average number of Oct4-GFP-positive Epi-iPSCs per well 9 days after the switch of macroH2A overexpressing or control cells to 2i plus LIF conditions is indicated. Values represent the average colony number from three independent wells. (D) qRT-PCR analysis of macroH2A.1 (light blue) and macroH2A.2 (purple) in Oct4-GFP EpiSCs transfected with Nanog (+Nanog) and macroH2A.1.s1 (+.1.s1), macroH2A.1.s2 (+.1.s2), macroH2A.1.s4 (+.1.s4), macroH2A.2 (+.2) or empty vector control (+empty); and in the resulting Oct4-GFP Epi-iPSCs, as well as control Oct4-GFP ESCs. (E) qRT-PCR analysis of Esrrb (light blue), Rex1 (red), Oct4 (green) and Klf4 (purple) in Oct4-GFP EpiSCs transfected with Nanog (+Nanog) and macroH2A.1.s1 (+.1.s1), macroH2A.1.s2 (+.1.s2), macroH2A.1.s4 (+.1.s4), macroH2A.2 (+.2) or empty vector control (+empty); and in the resulting Oct4-GFP Epi-iPSCs and control Oct4-GFP ESCs. Please note control Oct4-GFP ESCs express Nanog, but do not overexpress Nanog. Error bars indicate s.d.
Fig. 8.
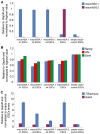
MacroH2A overexpression in ESCs. (A) qRT-PCR analysis of macroH2A.1 and macroH2A.2 expression in ESCs overexpressing macroH2A.1.s1, macroH2A.1.s2, macroH2A.1.s4 and macroH2A.2, or empty vector control. MacroH2A.1 is in blue and macroH2A.2 in purple. (B) qRT-PCR analysis of Nanog, Klf4 and Esrrb expression in ESCs overexpressing macroH2A.1.s1, macroH2A.1.s2, macroH2A.1.s4 and macroH2A.2, or empty vector control. Nanog is in blue, Klf4 in red and Esrrb in green. (C) qRT-PCR analysis of T-Brachyury and Gata4 expression in ESCs overexpressing macroH2A.1.s1, macroH2A.1.s2, macroH2A.1.s4 and macroH2A.2, or empty vector control. T-Brachyury is in blue and Gata4 in purple. Error bars indicate s.d.
Similar articles
- MacroH2A histone variants act as a barrier upon reprogramming towards pluripotency.
Gaspar-Maia A, Qadeer ZA, Hasson D, Ratnakumar K, Leu NA, Leroy G, Liu S, Costanzi C, Valle-Garcia D, Schaniel C, Lemischka I, Garcia B, Pehrson JR, Bernstein E. Gaspar-Maia A, et al. Nat Commun. 2013;4:1565. doi: 10.1038/ncomms2582. Nat Commun. 2013. PMID: 23463008 Free PMC article. - Macrohistone variants preserve cell identity by preventing the gain of H3K4me2 during reprogramming to pluripotency.
Barrero MJ, Sese B, Kuebler B, Bilic J, Boue S, Martí M, Izpisua Belmonte JC. Barrero MJ, et al. Cell Rep. 2013 Apr 25;3(4):1005-11. doi: 10.1016/j.celrep.2013.02.029. Epub 2013 Mar 28. Cell Rep. 2013. PMID: 23545500 - Histone variant macroH2A confers resistance to nuclear reprogramming.
Pasque V, Gillich A, Garrett N, Gurdon JB. Pasque V, et al. EMBO J. 2011 May 6;30(12):2373-87. doi: 10.1038/emboj.2011.144. EMBO J. 2011. PMID: 21552206 Free PMC article. - Histone variants as emerging regulators of embryonic stem cell identity.
Turinetto V, Giachino C. Turinetto V, et al. Epigenetics. 2015;10(7):563-73. doi: 10.1080/15592294.2015.1053682. Epigenetics. 2015. PMID: 26114724 Free PMC article. Review. - Ground rules of the pluripotency gene regulatory network.
Li M, Belmonte JC. Li M, et al. Nat Rev Genet. 2017 Mar;18(3):180-191. doi: 10.1038/nrg.2016.156. Epub 2017 Jan 3. Nat Rev Genet. 2017. PMID: 28045100 Review.
Cited by
- Histone Variant MacroH2A1 Plays an Isoform-Specific Role in Suppressing Epithelial-Mesenchymal Transition.
Hodge DQ, Cui J, Gamble MJ, Guo W. Hodge DQ, et al. Sci Rep. 2018 Jan 16;8(1):841. doi: 10.1038/s41598-018-19364-4. Sci Rep. 2018. PMID: 29339820 Free PMC article. - Histone variants and cellular plasticity.
Santoro SW, Dulac C. Santoro SW, et al. Trends Genet. 2015 Sep;31(9):516-27. doi: 10.1016/j.tig.2015.07.005. Epub 2015 Aug 20. Trends Genet. 2015. PMID: 26299477 Free PMC article. Review. - Erase and Rewind: Epigenetic Conversion of Cell Fate.
Pennarossa G, Zenobi A, Gandolfi CE, Manzoni EF, Gandolfi F, Brevini TA. Pennarossa G, et al. Stem Cell Rev Rep. 2016 Apr;12(2):163-70. doi: 10.1007/s12015-015-9637-1. Stem Cell Rev Rep. 2016. PMID: 26589198 Review. - MacroH2A histone variants limit chromatin plasticity through two distinct mechanisms.
Kozlowski M, Corujo D, Hothorn M, Guberovic I, Mandemaker IK, Blessing C, Sporn J, Gutierrez-Triana A, Smith R, Portmann T, Treier M, Scheffzek K, Huet S, Timinszky G, Buschbeck M, Ladurner AG. Kozlowski M, et al. EMBO Rep. 2018 Oct;19(10):e44445. doi: 10.15252/embr.201744445. Epub 2018 Sep 3. EMBO Rep. 2018. PMID: 30177554 Free PMC article. - Coaching from the sidelines: the nuclear periphery in genome regulation.
Buchwalter A, Kaneshiro JM, Hetzer MW. Buchwalter A, et al. Nat Rev Genet. 2019 Jan;20(1):39-50. doi: 10.1038/s41576-018-0063-5. Nat Rev Genet. 2019. PMID: 30356165 Free PMC article. Review.
References
- Bernstein E., Muratore–Schroeder T. L., Diaz R. L., Chow J. C., Changolkar L. N., Shabanowitz J., Heard E., Pehrson J. R., Hunt D. F., Allis C. D. (2008). A phosphorylated subpopulation of the histone variant macroH2A1 is excluded from the inactive X chromosome and enriched during mitosis. Proc. Natl. Acad. Sci. USA 105, 1533–1538 10.1073/pnas.0711632105 - DOI - PMC - PubMed
Publication types
MeSH terms
Substances
Grants and funding
- 092096/WT_/Wellcome Trust/United Kingdom
- 081277/WT_/Wellcome Trust/United Kingdom
- RG44593/WT_/Wellcome Trust/United Kingdom
- 086692/WT_/Wellcome Trust/United Kingdom
- G1000847/MRC_/Medical Research Council/United Kingdom
- G0800784/MRC_/Medical Research Council/United Kingdom
- 079249/WT_/Wellcome Trust/United Kingdom
- RG54943/WT_/Wellcome Trust/United Kingdom
LinkOut - more resources
Full Text Sources
Molecular Biology Databases

