Inhibition of HIV-1 particle assembly by 2',3'-cyclic-nucleotide 3'-phosphodiesterase - PubMed (original) (raw)
Inhibition of HIV-1 particle assembly by 2',3'-cyclic-nucleotide 3'-phosphodiesterase
Sam J Wilson et al. Cell Host Microbe. 2012.
Abstract
The expression of hundreds of interferon-stimulated genes (ISGs) causes the cellular "antiviral state" in which the replication of many viruses, including HIV-1, is attenuated. We conducted a screen for ISGs that inhibit HIV-1 virion production and found that 2',3'-cyclic-nucleotide 3'-phosphodiesterase (CNP), a membrane-associated protein with unknown function in mammals has this property. CNP binds to the structural protein Gag and blocks HIV-1 particle assembly after Gag and viral RNA have associated with the plasma membrane. Several primate lentiviruses are CNP-sensitive, and CNP sensitivity/resistance is determined by a single, naturally dimorphic, codon (E/K40) in the matrix domain of Gag. Like other antiretroviral proteins, CNP displays interspecies variation in antiviral activity. Mice encode an inactive CNP variant and a single amino acid difference in murine versus human CNP determines Gag binding and antiviral activity. Some cell types express high levels of CNP and we speculate that CNP evolved to restrict lentivirus replication therein.
Copyright © 2012 Elsevier Inc. All rights reserved.
Figures
Figure 1
CNP inhibits HIV-1 in an ISG screen. 293T cells were co-transfected with individual ISG expression vectors (pcDNA DEST40) and the plasmids required to make VSV-G pseudotyped HIV-1 particles. pCMV-HA-GFP was also co-transfected to monitor toxicity. (A) The infectious virion yield was determined by quantifying the number of GFP-positive MT4 target cells using flow cytometry at 48-hours postinfection. Data are represented as mean +/− SEM. (B) Pelletable viral CA (p24) abundance in purified supernatants as well as Gag precursor (Pr55), CA (p24), and HA-GFP expression in cell lysates were monitored by western blotting.
Figure 2
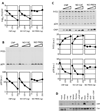
Expression of catalytically active or inactive, but not prenylation-defective, CNP at physiological levels reduces infectious HIV-1 viron yield and Gag processing. (A) 293T cells were cotransfected with an HIV-1 proviral plasmid (pNL4-3) and increasing amounts of plasmids expressing CNP, catalytically inactive CNP (NO CAT) and CNP lacking a prenylation CAAX box (NO PREN). At 48-hours post-transfection, infectious virion yield was measured using TZM-bl indicator cells and is plotted as relative light units (RLU) per ml. (B,C) Quantitative western blot analysis (LiCOR) of virion associated CA (p24) abundance (B), and cell-associated Gag expression/processing (C) was monitored. Charts below the blots show quantitation of the Pr55 and/or p24 signal in each lane of the virion (B) and cell lysate (C) western blots. (D) Expression of CNP in mouse tissues and transfected 293T cells was analyzed by western blotting. Blots were also probed with anti tubulin (Tub) as a loading control. See also Figure S1.
Figure 3
Spectrum of antiviral activity exhibited by CNP. 293T cells were transfected with expression vectors encoding CNP from: H. sapiens (Human), M. mulatta (Macaque), C. aethiops (AGM), M. musculus (mouse), B. torus (cow), O. aries (sheep) or an empty vector control, in combination with proviral clones (A–D) or plasmids required to generate single-cycle vectors (E–H). Data are represented as mean +/− SEM. At 48-hours after transfection, supernatants were harvested and yields of infectious HIV-1 (A), SIVmac239 (B) HIV-2 ROD10 (C) or HIV-2 7312A were monitored using TZM-bl target cells, as in Figure 2A. Yields of infectious VSV-G pseudotyped GFP-encoding vectors were determined by titration on MT4 cells for SIVAGMSAB (E) SIVAGMTAN (F) FIV (G) or MLV (H). Gag (A–D) and CNP (A–H) expression in cell lysates, and particulate CA protein in supernatants (A–D) was monitored by western blotting.
Figure 4
A single amino acid in the N-terminal P-loop domain confers the antiviral activity of CNP. (A) Alignment of human and murine CNP proteins, with salient features annotated. (B, C) 293T cells were cotransfected with a SIVMAC239 proviral plasmid along with plasmids expressing human CNP, mouse CNP or mutants thereof (B). The CNP proteins tested included human-mouse chimaeras (HsMm and MmHs); human CNP containing regions of murine sequence (69–75, 89–99 and 109–118); and human CNP containing single point mutations (V69L, V71L, D72E and R75H). (C) At 48-hours post-transfection, infectious virion yield was quantified by titration on TZM-bl cells. Data are represented as mean +/− SEM. Virion associated CA (p27) as well as CNP and Gag expression/processing in cell lysates was monitored by western blotting.
Figure 5
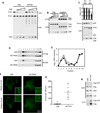
CNP targets the MA domain of HIV-1 Gag and block assembly after Gag reaches the plasma membrane. (A) Effect of CNP on VLP production driven by native codon (Gag) or codon optimized (synGag) expression, as determined by western blot analyses of 293T cell cultures transfected with Gag and CNP expression plasmids. (B) Effect of CNP on VLP production driven by HIV-1 Gag or Gag δGH expression, as determined by western blot analyses of 293T cell cultures transfected with Gag and CNP expression plasmids. (C) Effect of CNP on VLP production driven by plasmids required to make VSV-G pseudotyped single cycle MLV vectors, using either an MLV GagPol expression plasmid or MLV GagPol in which MA was substituted with HIV-1 MA. Infectious virion yield was quantified by titration on MT4 cells Data are represented as mean +/− SEM. Particulate MLV CA in culture supernatants as well as CNP and Gag expression/processing in cell lysates were assessed by western blotting. (D) Western blot analysis of CNP and HIV-1 Gag abundance after fractionation (lanes 1–10) of 293T cell lysates on a membrane flotation gradient following cotransfection with plasmids expressing HIV-1 Gag, a packageable HIV-1 vector genomic RNA and CNP or non-prenylated CNP (NO PREN). PNS = unfractionated post-nuclear supernatant. (E) Viral genomic RNA abundance determined by RT-qPCR analysis of the same fractions as in (D) is shown. (F) Representative images of 293T cells 24h after cotransfection with plasmids expressing either CNP or CNP lacking a prenylation sequence (NO PREN), along with plasmids encoding Gag and Gag-GFP (in a 5:1 ratio). (G) Quantification of fluorescent puncta in 3 fields from 10 randomly selected Gag/Gag-GFP and CNP expressing cells. The number of puncta per 100µm2 for each individual cell is plotted. Horzontal lines represent mean values. (H) Western blot analysis of Gag, CNP and á-tubulin expression in cells, and VLP abundance in culture supernatants for cells treated identically to those examined in (F, G).
Figure 6
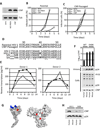
Selection and characterization of a CNP-resistant HIV-1 Gag mutant. (A) Western blot analysis of CNP expression in MT4 cells stably expressing intact CNP, or CNP lacking a prenylation sequence (NO PREN), generated by retroviral transduction. (B, C) Replication of GFP-encoding HIV-1 (NHG) (B), or NHG passaged on CNP expressing cells (C), on CNP-expressing MT4 cells is shown, as the percentage of infected cells determined by flow cytometry. (D) An alignment primate lentiviral MA sequences encompassing the E40K (highlighted) substitution, numbered according to HIV-1 (NL4-3). (E) Replication of wt (filled symbols) and E40K mutant (open symbols) HIV-1 (NHG) in peripheral blood mononuclear cells from two donors, monitored by assaying reverse transcriptase activity in culture supernatants. (F) Infectious virion yield, quantified by titration on MT4 cells following cotransfection of 293T cells with plasmids expressing CNP along with wt or E40K mutant NHG. Data are represented as mean +/− SEM. Virion associated CA (p24) as well as CNP and Gag expression/processing in cell lysates was monitored by western blotting. (G) A structural representation (PDB ID: 1UPH) of the monomer myristoylated MA region of Gag (Tang et al., 2004). Basic residues from the MA basic region are highlighted in blue and the dimorphic position 40 is highlighted in red. Also shown is the trimeric crystalline form of MA (PDB ID: 1HIW) with position 40 highlighted in red (Hill et al., 1996). (H) Purified HIV-1 virions from the experiment shown in (F) were normalized for p24 content, and subjected to western blot analysis using antibodies to p24 and CNP. See also Figure S2 and Table S1.
Figure 7
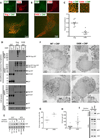
CNP binds Gag and inhibits HIV-1 particle production. (A,B) Representative images (acquired at the cell-coverslip interface) of 293T cells coexpressing CNP along with wt (A) or E40K (B) Gag and Gag-mCherry, and stained using AlexFluor®488 labeled anti-CNP. (C) Quantitative analysis of colocalization. Each symbol in the graph is the Pearson's coefficient for an individual cell and the horizontal line represents the mean value. Expanded images from the cell-coverslip interface are also shown. (D) Western blot analysis (αCNP or αGST) of glutathione-sepharose precipitates and cell lysates from crosslinker-treated 293T cells, coexpressing the indictated wt or mutant CNP, GST or Gag-GST proteins. Molecular weight markers indicate the mass in kDa. (E). Quantitative Western blot analysis of 293T cells transiently transfected with the indicated amount of a CNP expression vector (from Figure 2B) and MT4 cells stably expressing CNP. Numbers above each lane indicate the relative band intensities (LiCOR) (F) Electron microscopic images of CNP expressing MT4 cells infected with HIV-1, or the CNP-resistant HIV-1 point mutant E40K, 48-hours post infection (2 representative images for each are shown). (G) Percentage of infected cells that exhibited associated virions. One square of a 200 mesh grid (~20 cells) was counted for each data point (H) Quantification of the number of virions and budding structures on infected MT4 cells. Each data point represents an individual cell, and only cells that exhibited associated virions were evaluated (I) Quantitative western blot analysis of virion yield, CNP and Gag expression in MT4 CNP cells identically infected in parallel with those used in panels (F, G and H). Numbers above each lane indicate the relative band intensities (LiCOR). See also Figure S3.
Similar articles
- 2',3' cyclic nucleotide 3' phosphodiesterase 1 functional isoform antagonizes HIV-1 particle assembly.
Liang S, Zhang Q, Wang F, Wang S, Li G, Jiang D, Zeng H. Liang S, et al. Life Sci Alliance. 2024 Jan 2;7(3):e202302188. doi: 10.26508/lsa.202302188. Print 2024 Mar. Life Sci Alliance. 2024. PMID: 38167610 Free PMC article. - Subcellular Localization of HIV-1 gag-pol mRNAs Regulates Sites of Virion Assembly.
Becker JT, Sherer NM. Becker JT, et al. J Virol. 2017 Feb 28;91(6):e02315-16. doi: 10.1128/JVI.02315-16. Print 2017 Mar 15. J Virol. 2017. PMID: 28053097 Free PMC article. - Human immunodeficiency virus type 1 and related primate lentiviruses engage clathrin through Gag-Pol or Gag.
Popov S, Strack B, Sanchez-Merino V, Popova E, Rosin H, Göttlinger HG. Popov S, et al. J Virol. 2011 Apr;85(8):3792-801. doi: 10.1128/JVI.02329-10. Epub 2011 Feb 2. J Virol. 2011. PMID: 21289110 Free PMC article. - Rendezvous at Plasma Membrane: Cellular Lipids and tRNA Set up Sites of HIV-1 Particle Assembly and Incorporation of Host Transmembrane Proteins.
Thornhill D, Murakami T, Ono A. Thornhill D, et al. Viruses. 2020 Jul 31;12(8):842. doi: 10.3390/v12080842. Viruses. 2020. PMID: 32752131 Free PMC article. Review. - How HIV-1 Gag Manipulates Its Host Cell Proteins: A Focus on Interactors of the Nucleocapsid Domain.
Klingler J, Anton H, Réal E, Zeiger M, Moog C, Mély Y, Boutant E. Klingler J, et al. Viruses. 2020 Aug 13;12(8):888. doi: 10.3390/v12080888. Viruses. 2020. PMID: 32823718 Free PMC article. Review.
Cited by
- 2',3' cyclic nucleotide 3' phosphodiesterase 1 functional isoform antagonizes HIV-1 particle assembly.
Liang S, Zhang Q, Wang F, Wang S, Li G, Jiang D, Zeng H. Liang S, et al. Life Sci Alliance. 2024 Jan 2;7(3):e202302188. doi: 10.26508/lsa.202302188. Print 2024 Mar. Life Sci Alliance. 2024. PMID: 38167610 Free PMC article. - Interferon inhibits a model RNA virus via a limited set of inducible effector genes.
McDougal MB, De Maria AM, Ohlson MB, Kumar A, Xing C, Schoggins JW. McDougal MB, et al. EMBO Rep. 2023 Sep 6;24(9):e56901. doi: 10.15252/embr.202356901. Epub 2023 Jul 27. EMBO Rep. 2023. PMID: 37497756 Free PMC article. - The apparent interferon resistance of transmitted HIV-1 is possibly a consequence of enhanced replicative fitness.
Sugrue E, Wickenhagen A, Mollentze N, Aziz MA, Sreenu VB, Truxa S, Tong L, da Silva Filipe A, Robertson DL, Hughes J, Rihn SJ, Wilson SJ. Sugrue E, et al. PLoS Pathog. 2022 Nov 18;18(11):e1010973. doi: 10.1371/journal.ppat.1010973. eCollection 2022 Nov. PLoS Pathog. 2022. PMID: 36399512 Free PMC article. - Restriction factor screening identifies RABGAP1L-mediated disruption of endocytosis as a host antiviral defense.
Fernbach S, Spieler EE, Busnadiego I, Karakus U, Lkharrazi A, Stertz S, Hale BG. Fernbach S, et al. Cell Rep. 2022 Mar 22;38(12):110549. doi: 10.1016/j.celrep.2022.110549. Cell Rep. 2022. PMID: 35320721 Free PMC article. - Derivation and characterization of an HIV-1 mutant that rescues IP6 binding deficiency.
Poston D, Zang T, Bieniasz P. Poston D, et al. Retrovirology. 2021 Aug 28;18(1):25. doi: 10.1186/s12977-021-00571-3. Retrovirology. 2021. PMID: 34454514 Free PMC article.
References
- Eastman SW, Martin-Serrano J, Chung W, Zang T, Bieniasz PD. Identification of human VPS37C, a component of endosomal sorting complex required for transport-I important for viral budding. J Biol Chem. 2005;280:628–636. - PubMed
Publication types
MeSH terms
Substances
Grants and funding
- R01 AI091707/AI/NIAID NIH HHS/United States
- R37AI064003/AI/NIAID NIH HHS/United States
- R01AI50111/AI/NIAID NIH HHS/United States
- R01 AI050111/AI/NIAID NIH HHS/United States
- R37 AI064003/AI/NIAID NIH HHS/United States
- G0801822/MRC_/Medical Research Council/United Kingdom
- HHMI_/Howard Hughes Medical Institute/United States
LinkOut - more resources
Full Text Sources


