Toward an understanding of changes in diversity associated with fecal microbiome transplantation based on 16S rRNA gene deep sequencing - PubMed (original) (raw)
Toward an understanding of changes in diversity associated with fecal microbiome transplantation based on 16S rRNA gene deep sequencing
Dea Shahinas et al. mBio. 2012.
Abstract
Fecal microbiome transplantation by low-volume enema is an effective, safe, and inexpensive alternative to antibiotic therapy for patients with chronic relapsing Clostridium difficile infection (CDI). We explored the microbial diversity of pre- and posttransplant stool specimens from CDI patients (n = 6) using deep sequencing of the 16S rRNA gene. While interindividual variability in microbiota change occurs with fecal transplantation and vancomycin exposure, in this pilot study we note that clinical cure of CDI is associated with an increase in diversity and richness. Genus- and species-level analysis may reveal a cocktail of microorganisms or products thereof that will ultimately be used as a probiotic to treat CDI. IMPORTANCE Antibiotic-associated diarrhea (AAD) due to Clostridium difficile is a widespread phenomenon in hospitals today. Despite the use of antibiotics, up to 30% of patients are unable to clear the infection and suffer recurrent bouts of diarrheal disease. As a result, clinicians have resorted to fecal microbiome transplantation (FT). Donor stool for this type of therapy is typically obtained from a spouse or close relative and thoroughly tested for various pathogenic microorganisms prior to infusion. Anecdotal reports suggest a very high success rate of FT in patients who fail antibiotic treatment (>90%). We used deep-sequencing technology to explore the human microbial diversity in patients with Clostridium difficile infection (CDI) disease after FT. Genus- and species-level analysis revealed a cocktail of microorganisms in the Bacteroidetes and Firmicutes phyla that may ultimately be used as a probiotic to treat CDI.
Figures
FIG 1
Rank abundance curve comparison of refOTUs for all donors and recipients pre- and post-FT. Abundance has been shown in log scale on the y axis, and the rank order of the refOTUs is shown on the x axis. The dashed blue line corresponds (99% detection) to an abundance of 5. Summary statistics are tabulated in Table S1 in the supplemental material. D#-S, donor of successful transplant; D#-F, donor of failed transplant; R# Pre, recipient pre-FT; R# Post-S, recipient post-successful FT.
FIG 2
Rarefaction curve comparison of refOTUs for all donors and recipients pre- and post-FT. Phylogenetic diversity is plotted against the number of V5-V6 sequence reads for each donor and recipient pre- and post-FT. D-S, donor of successful transplant; D-F, donor of failed transplant; R Pre, recipient pre-FT; R Post-S, recipient post-successful FT; R Post-F, recipient post-failed FT. Each 30th point was plotted with the confidence interval at 95%.
FIG 3
Diversity statistics observed for all donors and recipients pre- and post-FT. Observed taxon richness, Shannon diversity, and Simpson diversity for each sample are shown. The lines in the plots represent the medians for each group. The asterisks denote the failed-FT samples. R Pre samples are characterized by fewer taxa and lower diversity than those of post-FT and donor samples. R Pre, recipient pre-FT samples; R Post, recipient post-FT samples; D, donor samples.
FIG 4
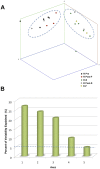
(A) PCoA. PCoA represents multivariate analysis, which explores community similarity by measuring phylogenetic branch length (UniFrac) of 16S rRNA tag sequences. The dots represent the projected shadows of the samples on the respective two-dimensional planes (xy, blue; yz, red; xz, green). The x axis, y axis, and z axis represent 27.1%, 24.0%, and 20.7% of the intersample variability, respectively. R Pre, recipient pre-FT; R Post-F, recipient post-failed FT; D-S, donor of successful transplant; R Post-S, recipient post-successful FT; D-F, donor of failed transplant. (B) PCoA axes in relation to observed variability. The percentage of variability observed is depicted in relation to the first five axes. The dashed line at 5.26% represents the amount of variability expected for each axis based on random events.
FIG 5
Phylum-level differences for each FT set. Donor (D) and post-successful (Post-S)-FT microbial populations are distinctive from pre-FT (R Pre) and post-failed (Post-F)-FT samples by higher levels of Bacteroidetes and Firmicutes and lower levels of Proteobacteria. At the phylum level, there is no difference observed between the failed-FT donor samples and the successful-FT donor samples.
FIG 6
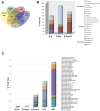
(A) Comparison of refOTU structures across the stool microbial communities. The Venn diagram displays the overlapping refOTUs for pooled samples belonging to each sample type. Each of the communities is characterized by more unique than overlapping refOTUs. The highest overlap is seen between R Pre and R Post-F samples as well as between R Post-S and D-S samples. R Pre, recipient pre-FT samples; R Post, recipient post-FT samples; D-S, donor samples. (B) Relative contributions of significant genera in pooled specimens before and after FT. Genera shown as a percentage of the total genera for each sample type are depicted. Only genera which change significantly (P < 0.05, EDGE analysis) following FT are depicted. R Pre, recipient pre-FT samples; R Post-S, recipient post-FT samples; D-S, donor samples. (C) Relative percentage of species in pooled specimens before and after FT. Species which increased significantly (P < 0.05, EDGE analysis) following FT are shown as absolute counts (number of V5-V6 sequence reads) for each sample type. R Pre, recipient pre-FT samples; R Post, recipient post-FT samples; D, donor samples.
Similar articles
- Longitudinal microbiome analysis of single donor fecal microbiota transplantation in patients with recurrent Clostridium difficile infection and/or ulcerative colitis.
Mintz M, Khair S, Grewal S, LaComb JF, Park J, Channer B, Rajapakse R, Bucobo JC, Buscaglia JM, Monzur F, Chawla A, Yang J, Robertson CE, Frank DN, Li E. Mintz M, et al. PLoS One. 2018 Jan 31;13(1):e0190997. doi: 10.1371/journal.pone.0190997. eCollection 2018. PLoS One. 2018. PMID: 29385143 Free PMC article. - Complete Microbiota Engraftment Is Not Essential for Recovery from Recurrent Clostridium difficile Infection following Fecal Microbiota Transplantation.
Staley C, Kelly CR, Brandt LJ, Khoruts A, Sadowsky MJ. Staley C, et al. mBio. 2016 Dec 20;7(6):e01965-16. doi: 10.1128/mBio.01965-16. mBio. 2016. PMID: 27999162 Free PMC article. Clinical Trial. - Fecal microbiota transplantation for relapsing Clostridium difficile infection in 26 patients: methodology and results.
Kelly CR, de Leon L, Jasutkar N. Kelly CR, et al. J Clin Gastroenterol. 2012 Feb;46(2):145-9. doi: 10.1097/MCG.0b013e318234570b. J Clin Gastroenterol. 2012. PMID: 22157239 - Fecal microbiota transplantation for recurrent clostridium difficile infection.
Brandt LJ, Reddy SS. Brandt LJ, et al. J Clin Gastroenterol. 2011 Nov;45 Suppl:S159-67. doi: 10.1097/MCG.0b013e318222e603. J Clin Gastroenterol. 2011. PMID: 21992957 Review. - Fecal microbiota transplantation for the treatment of Clostridium difficile infection.
Rao K, Safdar N. Rao K, et al. J Hosp Med. 2016 Jan;11(1):56-61. doi: 10.1002/jhm.2449. Epub 2015 Sep 7. J Hosp Med. 2016. PMID: 26344412 Free PMC article. Review.
Cited by
- The intestinal microbiome and surgical disease.
Krezalek MA, Skowron KB, Guyton KL, Shakhsheer B, Hyoju S, Alverdy JC. Krezalek MA, et al. Curr Probl Surg. 2016 Jun;53(6):257-93. doi: 10.1067/j.cpsurg.2016.06.001. Epub 2016 Jun 14. Curr Probl Surg. 2016. PMID: 27497246 Free PMC article. Review. No abstract available. - Tracking microbial colonization in fecal microbiota transplantation experiments via genome-resolved metagenomics.
Lee STM, Kahn SA, Delmont TO, Shaiber A, Esen ÖC, Hubert NA, Morrison HG, Antonopoulos DA, Rubin DT, Eren AM. Lee STM, et al. Microbiome. 2017 May 4;5(1):50. doi: 10.1186/s40168-017-0270-x. Microbiome. 2017. PMID: 28473000 Free PMC article. - Ecological Therapeutic Opportunities for Oral Diseases.
Hoare A, Marsh PD, Diaz PI. Hoare A, et al. Microbiol Spectr. 2017 Aug;5(4):10.1128/microbiolspec.bad-0006-2016. doi: 10.1128/microbiolspec.BAD-0006-2016. Microbiol Spectr. 2017. PMID: 28840820 Free PMC article. Review. - Immune homeostasis, dysbiosis and therapeutic modulation of the gut microbiota.
Peterson CT, Sharma V, Elmén L, Peterson SN. Peterson CT, et al. Clin Exp Immunol. 2015 Mar;179(3):363-77. doi: 10.1111/cei.12474. Clin Exp Immunol. 2015. PMID: 25345825 Free PMC article. Review. - Dynamic changes in short- and long-term bacterial composition following fecal microbiota transplantation for recurrent Clostridium difficile infection.
Weingarden A, González A, Vázquez-Baeza Y, Weiss S, Humphry G, Berg-Lyons D, Knights D, Unno T, Bobr A, Kang J, Khoruts A, Knight R, Sadowsky MJ. Weingarden A, et al. Microbiome. 2015 Mar 30;3:10. doi: 10.1186/s40168-015-0070-0. eCollection 2015. Microbiome. 2015. PMID: 25825673 Free PMC article.
References
- Lavallée C, et al. 2009. Fatal Clostridium difficile enteritis caused by the BI/NAP1/027 strain: a case series of ileal C. difficile infections. Clin. Microbiol. Infect. 15:1093–1099 - PubMed
- O’Connor JR, Johnson S, Gerding DN. 2009. Clostridium difficile infection caused by the epidemic BI/NAP1/027 strain. Gastroenterology 136:1913–1924 - PubMed
- Miller M, et al. 2010. Health care-associated Clostridium difficile infection in Canada: patient age and infecting strain type are highly predictive of severe outcome and mortality. Clin. Infect. Dis. 50:194–201 - PubMed
Publication types
MeSH terms
LinkOut - more resources
Full Text Sources
Other Literature Sources
Medical
Research Materials


