Single-neuron sequencing analysis of L1 retrotransposition and somatic mutation in the human brain - PubMed (original) (raw)
. 2012 Oct 26;151(3):483-96.
doi: 10.1016/j.cell.2012.09.035.
Xuyu Cai, Eunjung Lee, L Benjamin Hills, Princess C Elhosary, Hillel S Lehmann, J J Parker, Kutay D Atabay, Edward C Gilmore, Annapurna Poduri, Peter J Park, Christopher A Walsh
Affiliations
- PMID: 23101622
- PMCID: PMC3567441
- DOI: 10.1016/j.cell.2012.09.035
Single-neuron sequencing analysis of L1 retrotransposition and somatic mutation in the human brain
Gilad D Evrony et al. Cell. 2012.
Abstract
A major unanswered question in neuroscience is whether there exists genomic variability between individual neurons of the brain, contributing to functional diversity or to an unexplained burden of neurological disease. To address this question, we developed a method to amplify genomes of single neurons from human brains. Because recent reports suggest frequent LINE-1 (L1) retrotransposition in human brains, we performed genome-wide L1 insertion profiling of 300 single neurons from cerebral cortex and caudate nucleus of three normal individuals, recovering >80% of germline insertions from single neurons. While we find somatic L1 insertions, we estimate <0.6 unique somatic insertions per neuron, and most neurons lack detectable somatic insertions, suggesting that L1 is not a major generator of neuronal diversity in cortex and caudate. We then genotyped single cortical cells to characterize the mosaicism of a somatic AKT3 mutation identified in a child with hemimegalencephaly. Single-neuron sequencing allows systematic assessment of genomic diversity in the human brain.
Copyright © 2012 Elsevier Inc. All rights reserved.
Figures
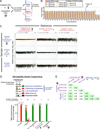
Figure 1. Isolation and genome amplification of single human neuronal nuclei
(A) Schematic of the method. (B) Fluorescence-activated cell sorting of cortical nuclei stained with NeuN shows two separable populations: NeuN+ (population I) and NeuN− (population II). A subset of population I (Ia) consisting of large neuronal nuclei was sorted and reanalyzed, confirming sort purity. Two populations of nuclei are sometimes apparent without NeuN staining, due to the increased background staining of the larger population I nuclei. Fluorescence decrease of the sorted population on reanalysis is always observed due to photobleaching and washing of non-specific staining in the first sort. (C) RT-PCR confirming the neuronal and non-neuronal identities of populations Ia and II, respectively, by assaying for expression of nuclear RNA for two neuronal (SNAP25 and SYT1), two astroglial (GFAP and AQP4), and input control (RPL37A) genes. RT-PCR and western blot experiments (Figures 1C and 1D) were performed with NeuN/Mef2c double labeling in which all NeuN+ nuclei were Mef2c+ (data not shown). (D) Western blot analysis of NeuN and Olig2 (an oligodendrocyte marker), confirming neuronal and non-neuronal identity, respectively, of populations Ia and II. (E) Quantitative MDA reactions monitored in real-time confirm accurate sorting of the desired number of nuclei. The time to amplify to a threshold above background (TimeT, analogous to qPCR CT value) is plotted on the y-axis (error bars ±1SD, n=7 or 8 reactions per condition). Points were fit to a semi-log line of slope −4.3, corresponding to 1.7-fold amplification per unit time. See also Figure S1.
Figure 2. Single-neuron genome-wide coverage, amplification bias, and identity fingerprinting
(A) Schematic of the low-coverage genome sequencing method. (B) Chromosome copy numbers of single cortical neurons from normal (UMB1465, 46XY) and trisomy 18 (UMB866, 47XY,+18) individuals. Copy numbers are normalized to the median copy number of each chromosome across the 8 single neurons, with autosomes adjusted to a median copy number of 2. Orange lines denote ±1 copy. (C) Higher-resolution copy number profiling in 6,000 equal-read bins of ~500kb in size shows that MDA bias can be corrected by normalization to an MDA-amplified reference. Orange lines denote ±1 copy, and purple points indicate off-scale bins. (D) Identifiler fingerprinting confirms the single neurons derive from the correct individuals, and measures allele preferential amplification (PA), low amplification (LA), allele dropout (AD), and discordant allele (DA) rates. (E) Fraction of genotypes by SNP microarray that are concordant between 3 single neurons and bulk DNA confirms the single neurons derive from the correct individual. See also Figure S2 and Table S1.
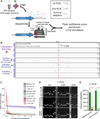
Figure 3. Genome-wide L1Hs insertion profiling (L1-IP) in single neurons
(A) Schematic of the L1-IP method. Primers 1 and 3 (L1Hs-AC and ILMN-Adaptor1_L1Hs-G, respectively) are specific to L1Hs diagnostic nucleotides. Primer 2 represents 8 different 5bp arbitrary seed primers, each containing the same barcode. Primer 4 (ILMN-SeqAdaptor2) incorporates an Illumina adaptor. See Table S3 for primer sequences. (B) L1-IP sequencing reads for one representative known reference insertion (L1Hs-KR-chr11_115209613). For each sample, a total read coverage track and a raw reads track are shown. Each read coverage track is scaled to the maximum peak height of the sample (scale on the right, in reads per million mapped reads, RPM). In the raw reads track, up to 3 reads are shown for each position. The green arrow marks the L1Hs insertion. Plus and minus strand reads are red and blue, respectively. Low-level MDA-chimera reads (yellow asterisks) are seen in the local region of the true insertion only in MDA-amplified samples. (C) The number of peaks found above different confidence score thresholds corresponding to known reference insertions (KR), known non-reference insertions (KNR), and unknown peaks (UNK). Data shown is the mean for all bulk (n=31), 100-cell (n=15) and 1-cell (n=303) samples from all 3 individuals (includes 15, 5 and 3 technical replicates, respectively). Shading around each line shows ±SD. KR and KNR insertions used for peak annotation are in Table S5. (D) Representative gel images of 3’ junction PCR (3’PCR) of 20 different germline insertions (8 KR, 8 KNR, and 4 UNK). (E) 3’PCR quantification of AD and LD in 1-neuron samples (n=83), of 3 heterozygous and 3 homozygous L1Hs insertions. AD and LD are quantified for heterozygous and homozygous insertions, respectively. NL, normal amplification; LA, low amplification; AD, allelic-dropout; LD, locus-dropout. See also Figures S3, S4, S5, and S6.
Figure 4. Chromosome L1-IP profile of single neurons
Circos plot (Krzywinski et al., 2009) of chromosomes 1 and 2, from representative L1-IP samples from individual 1465: (A) bulk DNA, (B) cortex 100-neurons #1, (C) cortex 1-neuron #2, and (D) caudate 1-neuron #1. Peaks are shown for loci where at least one of the samples has a peak confidence score >0.5. Bulk DNA track shows the mean confidence score across all bulk DNA samples of individual 1465. KR, KNR, and UNK peaks are colored as indicated in the key. Below 100-neuron and 1-neuron sample tracks are annotations for peaks present with a score >0.5 in bulk DNA but absent in the sample (‘Dropout’), and peaks absent from bulk DNA but present in the sample with a score >0.5 and at least 20kb away from the nearest KR/KNR insertion in the individual to exclude MDA-chimera peaks (‘Somatic peak’). Figures for all chromosomes can be found in Supplemental Data 1.
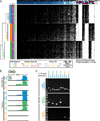
Figure 5. Single-neuron fingerprinting with L1-IP
(A) Unbiased hierarchical clustering of all samples sequenced in this study (excluding technical replicates) by transposon profile. Each row represents a sample, and each column represents a specific L1Hs insertion. Data is shown for all KR and KNR insertions with an average score of at least 0.5 in at least one individual’s samples. Black and white squares indicate presence or absence, respectively, of the insertion using a confidence score threshold of 0.5. All samples cluster correctly by individual except for 3 low-quality 1-neuron samples that cluster in a separate branch (bottom branch). Additional row annotations are colored for individual (I), sample type (S), and tissue (T), illustrating correct clustering by individual. Column annotations show annotation for KR (black) and KNR (white) insertions, and mean confidence scores across all samples of each individual. Samples also cluster by individual when including all insertions including unknown peaks (data not shown). (B) L1-IP read coverage for a representative polymorphic known non-reference insertion (L1Hs-KNR-1158). (C) Representative gel images of 3’PCR of 11 polymorphic germline insertions with 1-neuron DNA. 3’PCR products are only detected in individuals predicted by L1-IP to have the insertion. All polymorphic insertions tested are listed in Table S3.
Figure 6. Quantification of somatic L1Hs insertions, and validation of a somatic insertion, in single neurons
(A) Mean number (±SD) of somatic insertion candidates per single neuron in each tissue in the study, corrected for sensitivity. The insertion rates per neuron are shown before and after 3’PCR and secondary validation. Horizontal dashed lines and adjacent numbers indicate the mean number of insertions across all single neurons from all tissues. Low-quality samples that did not achieve the necessary KNR detection rate with a confidence score >0.5 were excluded from the analysis in a quality control check (‘QC-fail’ in Table S2). The number of cells included in each analysis were n=50, 45, 45, 50, 50, and 44 for 1465-cortex, 1465-caudate, 4638-cortex, 4638-caudate, 4643-cortex, and 4643-caudate, respectively, after removing low-quality samples failing quality control. (B) Mean number (±SD) of unique somatic insertion candidates (i.e. present in only one single neuron sample of the individual) per single neuron in each tissue, corrected for sensitivity. (C) Gel images of 3’PCR validation of a somatic L1Hs insertion found by L1-IP in individual 1465 cortex 1-neuron #2 (L1-IP peak ID chr15_67625710_plus_0_0). (D) Location of the somatic L1Hs insertion (L1-IP peak ID chr15_67625710_plus_0_0) in antisense orientation in intron 4 of the gene IQCH, and the corresponding L1-IP peak in 1465-cortex 1-neuron #2. The insertion’s target site duplication coordinates are chr15: 67,625,702–67,625,714 (hg19). A 5’ transduction (orange) identified the source L1Hs on chr8: 73,787,792–73,793,823. (E) Representative gel images from a 3’PCR screen of 83 1-neuron samples from individual 1465 cortex (24 1-neuron samples shown) for the somatic insertion in Figures 6C and 6D. The two cortical 1-neuron samples (#2 and #77) found to have the insertion are shown. 1-neuron #77 was found to have the insertion only in the 3’PCR screen since it was not profiled by L1-IP. 3’PCR product sequencing and full-length cloning confirmed the insertion had identical 5’ and 3’ breakpoints and TSD in both neurons (#2 and #77). See also Figure S7.
Figure 7. Single-cell analysis of a somatic brain AKT3 mutation causing hemimegalencephaly
(A) An axial T2-weighted image from the MRI of the hemimegalencephaly patient, HMG-3, with a somatic AKT3 E17K mutation shows the enlarged right hemisphere with abnormally thick and malformed cerebral gray matter and abnormal signal of the white matter (white dashed line). On the right is an MRI image of a normal brain. (B) Single-cell FACS sorting of HMG-3 resected cortex. (C) Representative Sanger sequencing traces of a bulk unsorted nuclei sample and single-cell samples from NeuN+ and NeuN− populations. The calculated % mosaicism for single-cell samples (corrected for allelic dropout) is shown. Arrow and asterisks mark the site of the AKT3 c.49G→A (E17K) mutation. See Table S4 for percent mosaicism of all samples from HMG-3.
Similar articles
- Somatic LINE-1 retrotransposition in cortical neurons and non-brain tissues of Rett patients and healthy individuals.
Zhao B, Wu Q, Ye AY, Guo J, Zheng X, Yang X, Yan L, Liu QR, Hyde TM, Wei L, Huang AY. Zhao B, et al. PLoS Genet. 2019 Apr 11;15(4):e1008043. doi: 10.1371/journal.pgen.1008043. eCollection 2019 Apr. PLoS Genet. 2019. PMID: 30973874 Free PMC article. - Resolving rates of mutation in the brain using single-neuron genomics.
Evrony GD, Lee E, Park PJ, Walsh CA. Evrony GD, et al. Elife. 2016 Feb 22;5:e12966. doi: 10.7554/eLife.12966. Elife. 2016. PMID: 26901440 Free PMC article. - L1 retrotransposons and somatic mosaicism in the brain.
Richardson SR, Morell S, Faulkner GJ. Richardson SR, et al. Annu Rev Genet. 2014;48:1-27. doi: 10.1146/annurev-genet-120213-092412. Epub 2014 Jul 14. Annu Rev Genet. 2014. PMID: 25036377 Review. - L1-associated genomic regions are deleted in somatic cells of the healthy human brain.
Erwin JA, Paquola AC, Singer T, Gallina I, Novotny M, Quayle C, Bedrosian TA, Alves FI, Butcher CR, Herdy JR, Sarkar A, Lasken RS, Muotri AR, Gage FH. Erwin JA, et al. Nat Neurosci. 2016 Dec;19(12):1583-1591. doi: 10.1038/nn.4388. Epub 2016 Sep 12. Nat Neurosci. 2016. PMID: 27618310 Free PMC article. - L1 Mosaicism in Mammals: Extent, Effects, and Evolution.
Faulkner GJ, Garcia-Perez JL. Faulkner GJ, et al. Trends Genet. 2017 Nov;33(11):802-816. doi: 10.1016/j.tig.2017.07.004. Epub 2017 Aug 7. Trends Genet. 2017. PMID: 28797643 Review.
Cited by
- Dynamic dysregulation of retrotransposons in neurodegenerative diseases at the single-cell level.
Deng W, Citu C, Liu A, Zhao Z. Deng W, et al. Genome Res. 2024 Oct 29;34(10):1687-1699. doi: 10.1101/gr.279363.124. Genome Res. 2024. PMID: 39424325 - A cell type-aware framework for nominating non-coding variants in Mendelian regulatory disorders.
Lee AS, Ayers LJ, Kosicki M, Chan WM, Fozo LN, Pratt BM, Collins TE, Zhao B, Rose MF, Sanchis-Juan A, Fu JM, Wong I, Zhao X, Tenney AP, Lee C, Laricchia KM, Barry BJ, Bradford VR, Jurgens JA, England EM, Lek M, MacArthur DG, Lee EA, Talkowski ME, Brand H, Pennacchio LA, Engle EC. Lee AS, et al. Nat Commun. 2024 Sep 27;15(1):8268. doi: 10.1038/s41467-024-52463-7. Nat Commun. 2024. PMID: 39333082 Free PMC article. - Mechanism of neurodegeneration mediated by clonal inflammatory microglia.
Vicario R, Fragkogianni S, Pokrovskii M, Mayer C, Lopez-Rodrigo E, Hu Y, Ogishi M, Alberdi A, Baako A, Ay O, Plu I, Sazdovitch V, Heritier S, Cohen-Aubart F, Shor N, Miyara M, Nguyen-Khac F, Viale A, Idbaih A, Amoura Z, Rosenblum MK, Zhang H, Karnoub ER, Sashittal P, Jakatdar A, Iacobuzio-Donahue CA, Abdel-Wahab O, Tabar V, Socci ND, Elemento O, Diamond EL, Boisson B, Casanova JL, Seilhean D, Haroche J, Donadieu J, Geissmann F. Vicario R, et al. bioRxiv [Preprint]. 2024 Jul 31:2024.07.30.605867. doi: 10.1101/2024.07.30.605867. bioRxiv. 2024. PMID: 39131366 Free PMC article. Preprint. - DNA mismatch and damage patterns revealed by single-molecule sequencing.
Liu MH, Costa BM, Bianchini EC, Choi U, Bandler RC, Lassen E, Grońska-Pęski M, Schwing A, Murphy ZR, Rosenkjær D, Picciotto S, Bianchi V, Stengs L, Edwards M, Nunes NM, Loh CA, Truong TK, Brand RE, Pastinen T, Wagner JR, Skytte AB, Tabori U, Shoag JE, Evrony GD. Liu MH, et al. Nature. 2024 Jun;630(8017):752-761. doi: 10.1038/s41586-024-07532-8. Epub 2024 Jun 12. Nature. 2024. PMID: 38867045 Free PMC article. - Mapping recurrent mosaic copy number variation in human neurons.
Sun C, Kathuria K, Emery SB, Kim B, Burbulis IE, Shin JH; Brain Somatic Mosaicism Network; Weinberger DR, Moran JV, Kidd JM, Mills RE, McConnell MJ. Sun C, et al. Nat Commun. 2024 May 17;15(1):4220. doi: 10.1038/s41467-024-48392-0. Nat Commun. 2024. PMID: 38760338 Free PMC article.
References
Publication types
MeSH terms
Substances
Grants and funding
- HHMI/Howard Hughes Medical Institute/United States
- T32 GM007753/GM/NIGMS NIH HHS/United States
- R01 NS079277/NS/NINDS NIH HHS/United States
- R01 NS035129/NS/NINDS NIH HHS/United States
- T32GM007753/GM/NIGMS NIH HHS/United States
- T32GM007726/GM/NIGMS NIH HHS/United States
LinkOut - more resources
Full Text Sources
Other Literature Sources


