MICU1 is an essential gatekeeper for MCU-mediated mitochondrial Ca(2+) uptake that regulates cell survival - PubMed (original) (raw)
. 2012 Oct 26;151(3):630-44.
doi: 10.1016/j.cell.2012.10.011.
Patrick Doonan, César Cárdenas, Harish C Chandramoorthy, Marioly Müller, Russell Miller, Nicholas E Hoffman, Rajesh Kumar Gandhirajan, Jordi Molgó, Morris J Birnbaum, Brad S Rothberg, Don-On Daniel Mak, J Kevin Foskett, Muniswamy Madesh
Affiliations
- PMID: 23101630
- PMCID: PMC3486697
- DOI: 10.1016/j.cell.2012.10.011
MICU1 is an essential gatekeeper for MCU-mediated mitochondrial Ca(2+) uptake that regulates cell survival
Karthik Mallilankaraman et al. Cell. 2012.
Abstract
Mitochondrial Ca(2+) (Ca(2+)(m)) uptake is mediated by an inner membrane Ca(2+) channel called the uniporter. Ca(2+) uptake is driven by the considerable voltage present across the inner membrane (ΔΨ(m)) generated by proton pumping by the respiratory chain. Mitochondrial matrix Ca(2+) concentration is maintained five to six orders of magnitude lower than its equilibrium level, but the molecular mechanisms for how this is achieved are not clear. Here, we demonstrate that the mitochondrial protein MICU1 is required to preserve normal [Ca(2+)](m) under basal conditions. In its absence, mitochondria become constitutively loaded with Ca(2+), triggering excessive reactive oxygen species generation and sensitivity to apoptotic stress. MICU1 interacts with the uniporter pore-forming subunit MCU and sets a Ca(2+) threshold for Ca(2+)(m) uptake without affecting the kinetic properties of MCU-mediated Ca(2+) uptake. Thus, MICU1 is a gatekeeper of MCU-mediated Ca(2+)(m) uptake that is essential to prevent [Ca(2+)](m) overload and associated stress.
Copyright © 2012 Elsevier Inc. All rights reserved.
Figures
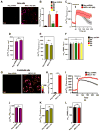
Figure 1. MICU1 Silencing Promotes Basal Ca2+m Accumulation
(A) Representative confocal images of rhod-2 fluorescence in HeLa Neg shRNA (control) and MICU1 shRNA clone KD #B6 cells. (B) Quantification of basal rhod-2 fluorescence in HeLa Neg shRNA (control) and MICU1 shRNA KD clones. Mean ± SEM.; ns, not significant; **: P < 0.01, n=3. (C) Kinetics of Ca2+m in HeLa Neg shRNA (control) and MICU1 shRNA KD clone #B6 cells in response to histamine (100 μM). Solid lines: mean; shaded regions: ± SEM.; n=3. (D) and (E) Quantification of cytosolic (purple) and mitochondrial (green) [Ca2+] peak amplitudes in HeLa Neg shRNA (control) and MICU1 shRNA KD clone #B6 cells after stimulation with 100 μM histamine. Mean ± SEM.; n=3. (F) Quantification of TMRE fluorescence to assess ΔΨm in HeLa Neg shRNA (control) and MICU1 shRNA KD clones. Mean ± SEM.; n=3. See also Figure S1. (G) Representative confocal images of rhod-2 fluorescence in Neg shRNA (control) and MICU1 shRNA clone KD #B6 ECs. (H) Quantification of basal rhod-2 fluorescence in Neg shRNA (control) and MICU1 KD ECs. Mean ± SEM.; **: P < 0.01, n=3. (I) Kinetics of Ca2+m in Neg shRNA (control) and MICU1 KD ECs in response to histamine (100 μM). Solid lines: mean; shaded regions: ± SEM; n=3. (J) and (K) Quantification of cytosolic (purple) and mitochondrial (green) [Ca2+] peak amplitudes in Neg shRNA (control) and MICU1 KD ECs after stimulation with histamine (100 μM). Mean ± SEM.; n=3. (L) Quantification of TMRE fluorescence to assess ΔΨm in Neg shRNA (control) and MICU1 shRNA KD #B6 ECs. Mean ± SEM; n=3.
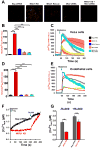
Figure 2. MICU1 Knockdown-Induced Basal Ca2+m Accumulation is Mediated by MCU-Dependent Ca2+ Uptake
(A) Representative confocal images of basal rhod-2 fluorescence in HeLa cells stably expressing Neg shRNA, MICU1 KD shRNA and MICU1 Rescue, and WT cells treated with MCU siRNA and MICU1 KD cells treated with MCU siRNA. (B) Quantification of basal rhod-2 fluorescence of cells in (A). Mean ± SEM; ***: P < 0.001, n=3. (C) Responses of Ca2+m in cells in (A) to 100 μM histamine. Solid lines: mean; shaded regions: ± SEM; n=3. (D) Quantification of basal rhod-2 fluorescence in ECs stably expressing Neg shRNA, MICU1 KD shRNA and MICU1 Rescue, and WT cells treated with MCU siRNA and MICU1 KD cells treated with MCU siRNA. Mean ± SEM; ***: P < 0.001, n=3. (E) Responses of Ca2+m in ECs in (D) to 100 μM histamine. Solid lines: mean; shaded regions: ± SEM; n=3. (F) and (G) Representative traces and quantification of basal bath [Ca2+] (Fura FF fluorescence) in Neg shRNA (black) and MICU1KD (red) permeabilized HEK293 cells before and after Ru360. Mean ± SEM; ns, not different; **: P <0.01, n=3. See also Figure S2
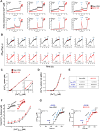
Figure 3. MICU1 Controls MCU-Mediated Ca2+m Uptake in Low [Ca2+]i
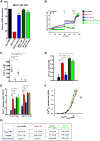
(A) Permeabilized stable Neg shRNA (black) and MICU1 KD (red) HEK293 cells were pulsed with different [Ca2+] as indicated. Traces show bath [Ca2+] (μM). Solid lines: mean; shaded regions: ± SEM; n=3. (B) Representative traces indicate ΔΨm (JC-1 ratio) in permeabilized Neg shRNA (black) and MICU1 KD (red) HEK293 cells in response to Ca2+ pulses and CCCP. (C) Change in bath [Ca2+] due to Ca2+m uptake in response to various bath [Ca2+] in control (black) and MICU1 KD (red) cells. Uptake derived from single exponential fit of bath [Ca2+] kinetics following Ca2+ pulses. Inset shows responses up to 5 μM bath [Ca2+]. (D) Rate of [Ca2+]m as function of bath [Ca2+] derived from single exponential fits of bath [Ca2+] responses following Ca2+ pulses. Solid line is Hill equation fit of data. Reduced uptake rate observed at [Ca2+] > 20 μM is due to ΔΨm depolarization, and was not used in fitting. (E) Kinetic parameters derived from Hill equation fits of data in (C). (F) Total Ca2+m uptake after each Ca2+ pulse was determined in neg shRNA (black) and MICU1 KD (red) cells by recording Ca2+ released by CCCP. Inset: Traces obtained from cells with no added Ca2+ pulse. Solid lines: mean; shaded regions: Mean ± SEM; n= 3. **, *: P < 0.01 and 0.05, respectively. (G) Ru360 blocks basal Ca2+m uptake in MICU1 KD cells as well as uptake in KD and control cells in response to Ca2+ pulses. Representative traces from 3 experiments. See also Figure S3.
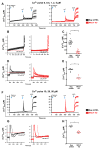
Figure 4. MICU1 Silencing Lowers the Set-Point for Basal MCU-Mediated Ca2+ Uptake
(A) Overlay of bath [Ca2+] responses to 0, 0.5, 1, 2 and 5 μM Ca2+ pulses in permeabilized Neg shRNA (black; left panel) and MICU1 KD cells (red; right panel). Solid lines: means; shaded areas: Mean ± SEM; n=3 at each [Ca2+]. (B) Overlay of bath [Ca2+] kinetics during 450 sec following plasma membrane permeabilization and exposure to Tg in Neg shRNA control (black) and MICU1 KD (red) cells. Solid lines: means; shaded areas: Mean ± SEM; n=3 at each [Ca2+]. (C) Scatter plot of bath [Ca2+] at 450 sec from experiments shown in B. Mean ± SEM shown. ***, P < 0.001 (D) Overlay of bath [Ca2+] kinetics during 300 sec following 0.5, 1, 2 and 5 μM bath Ca2+ pulses in permeabilized Neg shRNA (black; left panel) and MICU1 KD cells (red; right panel). Solid lines: means; shaded areas: Mean ± SEM; n=3 at each [Ca2+]. (E) Scatter plot of bath [Ca2+] at 300 sec from experiments shown in D. Mean ± SEM shown. ***, P < 0.001. (F) Overlay of bath [Ca2+] responses to 10, 20 and 50 μM Ca2+ pulses in permeabilized Neg shRNA (black; left panel) and MICU1 KD cells (red; right panel). Solid lines: means; shaded areas: Mean ± SEM; n=3 at each [Ca2+]. (G) Overlay of bath [Ca2+] kinetics during 300 sec following 10, 20 and 50 μM bath Ca2+ pulses in permeabilized Neg shRNA (black; left panel) and MICU1 KD cells (red; right panel). Solid lines: means; shaded areas: Mean ± SEM; n=3 at each [Ca2+]. (H) Scatter plot of bath [Ca2+] at 300 sec from experiments in (G). ***: P < 0.001 See also Figure S4
Figure 5. EF Hand Domains of MICU1 Regulate the Ca2+ Threshold for MCU-Mediated Ca2+ Uptake
(A) Knockdown of MICU1 mRNA levels in HEK293 Neg shRNA, MICU1 KD, MICU1 Rescue, MICU1 KD stably expressing shRNA insensitive MICU1 cDNA harboring either D231A and E242K mutation (EF1 mutant) or D421A and E432K mutation (EF2 mutant) cells (mean ± SEM.; n=3). (B) Permeabilized HEK293 Neg shRNA, MICU1 KD, MICU1 Rescue, MICU1 KD stably expressing shRNA insensitive MICU1 cDNA harboring either EF1 or EF2 mutations, cells were pulsed with 1 μM Ca2+ as indicated. Representative traces show bath [Ca2+] (μM). (C) Quantification of basal bath [Ca2+] at 450 sec after permeabilization. *, **, ***: P < 0.05, 0.01, 0.001, respectively. Mean ± SEM; n=3. (D) Change in bath [Ca2+] due to Ca2+m uptake in response to 1 μM Ca2+ pulse. Uptake derived from single exponential fit of bath [Ca2+] kinetics following Ca2+ pulse. Mean ± S.E.; **, ***: P < 0.01 and 0.001, respectively. n.s. not significant. Mean ± SEM; n=3. (E) Total Ca2+m uptake after basal accumulation (no Ca2+ pulse) or 1 μM Ca2+ pulse determined by recording Ca2+ released by CCCP addition at t = 750 sec. Mean ± S.E.; *, **: P < 0.05 and 0.01, respectively. Mean ± SEM; n=3. (F) Rate of Ca2+m uptake as function of bath [Ca2+] derived from single exponential fits of bath [Ca2+] responses following Ca2+ pulses in permeabilized EF1 or EF2 mutant cells. Solid line is Hill equation fit of the data. Reduced uptake rate observed at [Ca2+] > 20 μM is due to ΔΨm depolarization, and was not used in the fitting. (G) Kinetic parameters derived from Hill equation fits of data in (F). See also Figure S5.
Figure 6. MICU1 Deficiency Elevates Basal Mitochondrial ROS
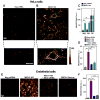
(A and B)Representative confocal images show MitoSOX Red fluorescence in Neg shRNA (A) and MICU1 KD (B) HeLa cells. Bottom panels: Enlarged portions of fields showing single cells depicting mitochondrial localization of indicator. (C) Quantification of MitoSOX Red fluorescence in Neg shRNA and MICU1 KD cells, with or without NADPH oxidase inhibitor DPI (10 μM). Mitochondrial respiratory Complex III blocker antimycin A (AA) used as positive control. Mean ± SEM; **: P<0.01, ns, not different; n=3. (D) Quantification of MitoSOX Red fluorescence in MICU1 KD, MCU siRNA treated MICU1 KD and MICU1 rescue HeLa cells. Mean ± SEM; **: P<0.01; n = 3. (E)Representative confocal images of MitoSOX Red fluorescence in Neg shRNA, MICU1 KD, MICU1 KD +MCU siRNA and MICU1 rescue ECs. (F) Quantification of MitoSOX Red fluorescence in MICU1 KD, MCU siRNA treated MICU1 KD and MICU1 rescue ECs. Mean ± SEM; **: P<0.01; n = 3. See also Figure S6.
Figure 7. MICU1 Deficiency Impairs Cell Migration and Sensitizes Cells to Apoptotic Cell Death
(A) HeLa cells were labeled with CFSE and cell proliferation was determined by flow cytometry. Representative histograms (left) and quantification (right) of CFSE distribution after 72 hrs. Mean ± SEM; n=3. (B) Representative images and quantification of cell migration in Neg shRNA, MICU1KD and MICU1 rescue ECs 8 hrs post scratch. Mean ± SEM; n=3. (C) Quantification of cell death after 20 hrs of C2-Ceramide (40 μM) treatment. Neg shRNA and MICU1 KD cells treated with adenoviral manganese superoxide dismutase (MnSOD) and glutathione peroxidase 1 (GPX1) for 36 hrs before challenged with C2-Ceramide for 20 hrs; Mean ± SEM; *, ***: P < 0.05 and 0.001, respectively; n=3. (D) Quantification of cell death in endothelial cells after 12 hrs of LPS and cycloheximide treatment. Neg shRNA and MICU1 KD endothelial cells treated with adenoviral MnSOD and GPX1 for 36 hrs before challenge with LPS and cycloheximide for 12 hrs; Mean ± SEM; ***: P < 0.001; n=3.
Similar articles
- MICU1 motifs define mitochondrial calcium uniporter binding and activity.
Hoffman NE, Chandramoorthy HC, Shamugapriya S, Zhang X, Rajan S, Mallilankaraman K, Gandhirajan RK, Vagnozzi RJ, Ferrer LM, Sreekrishnanilayam K, Natarajaseenivasan K, Vallem S, Force T, Choi ET, Cheung JY, Madesh M. Hoffman NE, et al. Cell Rep. 2013 Dec 26;5(6):1576-1588. doi: 10.1016/j.celrep.2013.11.026. Epub 2013 Dec 12. Cell Rep. 2013. PMID: 24332854 Free PMC article. - Structural and mechanistic insights into MICU1 regulation of mitochondrial calcium uptake.
Wang L, Yang X, Li S, Wang Z, Liu Y, Feng J, Zhu Y, Shen Y. Wang L, et al. EMBO J. 2014 Mar 18;33(6):594-604. doi: 10.1002/embj.201386523. Epub 2014 Feb 10. EMBO J. 2014. PMID: 24514027 Free PMC article. - The structure of the MICU1-MICU2 complex unveils the regulation of the mitochondrial calcium uniporter.
Wu W, Shen Q, Zhang R, Qiu Z, Wang Y, Zheng J, Jia Z. Wu W, et al. EMBO J. 2020 Oct 1;39(19):e104285. doi: 10.15252/embj.2019104285. Epub 2020 Aug 13. EMBO J. 2020. PMID: 32790952 Free PMC article. - MICU1's calcium sensing beyond mitochondrial calcium uptake.
Kaye SD, Goyani S, Tomar D. Kaye SD, et al. Biochim Biophys Acta Mol Cell Res. 2024 Jun;1871(5):119714. doi: 10.1016/j.bbamcr.2024.119714. Epub 2024 Mar 29. Biochim Biophys Acta Mol Cell Res. 2024. PMID: 38555977 Review. - Mitochondrial Ca2+ transport in the endothelium: regulation by ions, redox signalling and mechanical forces.
Alevriadou BR, Shanmughapriya S, Patel A, Stathopulos PB, Madesh M. Alevriadou BR, et al. J R Soc Interface. 2017 Dec;14(137):20170672. doi: 10.1098/rsif.2017.0672. Epub 2017 Dec 13. J R Soc Interface. 2017. PMID: 29237825 Free PMC article. Review.
Cited by
- MICU2, a paralog of MICU1, resides within the mitochondrial uniporter complex to regulate calcium handling.
Plovanich M, Bogorad RL, Sancak Y, Kamer KJ, Strittmatter L, Li AA, Girgis HS, Kuchimanchi S, De Groot J, Speciner L, Taneja N, Oshea J, Koteliansky V, Mootha VK. Plovanich M, et al. PLoS One. 2013;8(2):e55785. doi: 10.1371/journal.pone.0055785. Epub 2013 Feb 7. PLoS One. 2013. PMID: 23409044 Free PMC article. - Hypoxia and Mitochondrial Dysfunction in Pregnancy Complications.
Hu XQ, Zhang L. Hu XQ, et al. Antioxidants (Basel). 2021 Mar 8;10(3):405. doi: 10.3390/antiox10030405. Antioxidants (Basel). 2021. PMID: 33800426 Free PMC article. Review. - Coupled transmembrane mechanisms control MCU-mediated mitochondrial Ca2+ uptake.
Vais H, Payne R, Paudel U, Li C, Foskett JK. Vais H, et al. Proc Natl Acad Sci U S A. 2020 Sep 1;117(35):21731-21739. doi: 10.1073/pnas.2005976117. Epub 2020 Aug 14. Proc Natl Acad Sci U S A. 2020. PMID: 32801213 Free PMC article. - The Role of Mitochondrial Functional Proteins in ROS Production in Ischemic Heart Diseases.
Pei H, Yang Y, Zhao H, Li X, Yang D, Li D, Yang Y. Pei H, et al. Oxid Med Cell Longev. 2016;2016:5470457. doi: 10.1155/2016/5470457. Epub 2016 Mar 28. Oxid Med Cell Longev. 2016. PMID: 27119006 Free PMC article. Review. - Molecular Tuning of the Axonal Mitochondrial Ca2+ Uniporter Ensures Metabolic Flexibility of Neurotransmission.
Ashrafi G, de Juan-Sanz J, Farrell RJ, Ryan TA. Ashrafi G, et al. Neuron. 2020 Feb 19;105(4):678-687.e5. doi: 10.1016/j.neuron.2019.11.020. Epub 2019 Dec 17. Neuron. 2020. PMID: 31862210 Free PMC article.
References
- Azzone GF, Bragadin M, Pozzan T, Antone PD. Proton electrochemical potential in steady state rat liver mitochondria. Biochim Biophys Acta. 1977;459:96–109. - PubMed
- Balaban RS, Nemoto S, Finkel T. Mitochondria, oxidants, and aging. Cell. 2005;120:483–495. - PubMed
- Bernardi P. Mitochondrial transport of cations: channels, exchangers, and permeability transition. Physiol Rev. 1999;79:1127–1155. - PubMed
Publication types
MeSH terms
Substances
Grants and funding
- HL086699-01A2S1/HL/NHLBI NIH HHS/United States
- MH059937/MH/NIMH NIH HHS/United States
- R37 GM056328/GM/NIGMS NIH HHS/United States
- R01 DK056886/DK/NIDDK NIH HHS/United States
- 1S10RR027327-01/RR/NCRR NIH HHS/United States
- R01 MH059937/MH/NIMH NIH HHS/United States
- R01 GM056328/GM/NIGMS NIH HHS/United States
- R01 HL086699/HL/NHLBI NIH HHS/United States
- HL086699/HL/NHLBI NIH HHS/United States
- GM56328/GM/NIGMS NIH HHS/United States
- S10 RR027327/RR/NCRR NIH HHS/United States
- P01 DK049210/DK/NIDDK NIH HHS/United States
LinkOut - more resources
Full Text Sources
Other Literature Sources
Molecular Biology Databases
Miscellaneous
