Unraveling inflammatory responses using systems genetics and gene-environment interactions in macrophages - PubMed (original) (raw)
. 2012 Oct 26;151(3):658-70.
doi: 10.1016/j.cell.2012.08.043.
Brian J Bennett, Charles R Farber, Anatole Ghazalpour, Calvin Pan, Nam Che, Pingzi Wen, Hong Xiu Qi, Adonisa Mutukulu, Nathan Siemers, Isaac Neuhaus, Roumyana Yordanova, Peter Gargalovic, Matteo Pellegrini, Todd Kirchgessner, Aldons J Lusis
Affiliations
- PMID: 23101632
- PMCID: PMC3513387
- DOI: 10.1016/j.cell.2012.08.043
Unraveling inflammatory responses using systems genetics and gene-environment interactions in macrophages
Luz D Orozco et al. Cell. 2012.
Abstract
Many common diseases have an important inflammatory component mediated in part by macrophages. Here we used a systems genetics strategy to examine the role of common genetic variation in macrophage responses to inflammatory stimuli. We examined genome-wide transcript levels in macrophages from 92 strains of the Hybrid Mouse Diversity Panel. We exposed macrophages to control media, bacterial lipopolysaccharide (LPS), or oxidized phospholipids. We performed association mapping under each condition and identified several thousand expression quantitative trait loci (eQTL), gene-by-environment interactions, and eQTL "hot spots" that specifically control LPS responses. We used siRNA knockdown of candidate genes to validate an eQTL hot spot in chromosome 8 and identified the gene 2310061C15Rik as a regulator of inflammatory responses in macrophages. We have created a public database where the data presented here can be used as a resource for understanding many common inflammatory traits that are modeled in the mouse and for the dissection of regulatory relationships between genes.
Copyright © 2012 Elsevier Inc. All rights reserved.
Figures
Figure 1. Environmental, Genetic and GxE interaction effects on gene expression
Expression levels are plotted as the log2(microarray intensity) on the Y-axis, for mouse strains on the X-axis. Each dot represents the levels of a gene for a given strain in control (blue dots) and treated cells (red dots). (A) Hmox1 expression in response to OxPAPC and (B) Hmox1 in response LPS, illustrate environmental effects. (C) Npl levels are influenced by genetic effects. (D) Expression levels of Ifi205 are influenced by GxE interactions. See also Figures S1 and S2.
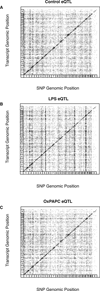
Figure 2. Genome-wide association of gene expression
Association using microarray expression of macrophages in various conditions. Each dot represents a significant association between a transcript and a SNP. Genomic position of the SNPs and transcripts are shown on the X and Y-axes, respectively. (A) Association in control condition. (B) Association in LPS condition. (C) Association in OxPAPC condition. See also Figure S3, Table S2 and Table S7.
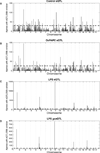
Figure 3. eQTL hotspots
The number of genes mapping to each 2-Mb bin is shown on the Y-axis and the genomic position of the bin is on the X-axis. The horizontal dashed line represents the significance threshold. (A) Hotspots in control eQTL. (B) Hotspots in OxPAPC eQTL. (C) Hotspots in LPS eQTL. (D) Hotspots in LPS _gxe_QTL. See also Figure S4, Table S3 and Table S4.
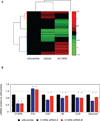
Figure 4. Expression levels in LPS condition after knock-down of candidate genes
(A) Microarray expression levels in LPS condition for 273 genes affected by knock-down of the candidate genes Gcsh (siGcsh) and 2310061C15Rik (siC15Rik). For each gene on the Y-axis, expression is plotted as the mean of the siRNAs (X-axis) that significantly affected expression relative to the scramble control on a log2 scale. (B) Microarray expression levels for the genes Il1b, Csf1, Il6, Ccl2 and Serpine1, after knock-down of the candidate gene 2310061C15Rik (C15Rik). Data are presented as mean +/− standard deviation. See also Table S5.
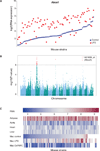
Figure 5. Database plots for Abca1
Sample plots for a given gene of interest that can be obtained from our online database. (A) LPS response of Abca1. (B) Genome-wide association for the expression of Abca1. (C) Relative expression levels among mouse strains of the HMDP in macrophages and different tissues.
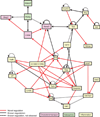
Figure 6. Abca1 and LPS-activation regulatory network defined by _trans_-eQTL
Causal regulatory relationships between genes were defined using LPS _trans_-eQTL. Novel relationships are shown in red lines, and previously described relationships are in black lines. Dotted lines are previously described relationships which were not identified in the LPS _trans_-eQTL. See also Figure S5.
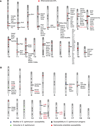
Figure 7. Candidate genes in QTL for Atherosclerosis and susceptibility to Salmonella
Ideograms of mouse autosomes showing the position of clinical QTL identified through multiple studies. The peak linkage region is marked with a red, blue, green or black bar. Genes listed for each QTL are _cis_-eQTL identified in this study. Genes discussed in the text are highlighted in red. (A) Atherosclerosis QTL. (B) QTL for susceptibility to Salmonella thyphimurium.
Similar articles
- Genetic control of the innate immune response.
Wells CA, Ravasi T, Faulkner GJ, Carninci P, Okazaki Y, Hayashizaki Y, Sweet M, Wainwright BJ, Hume DA. Wells CA, et al. BMC Immunol. 2003 Jun 26;4:5. doi: 10.1186/1471-2172-4-5. Epub 2003 Jun 26. BMC Immunol. 2003. PMID: 12826024 Free PMC article. - Replication and narrowing of gene expression quantitative trait loci using inbred mice.
Gatti DM, Harrill AH, Wright FA, Threadgill DW, Rusyn I. Gatti DM, et al. Mamm Genome. 2009 Jul;20(7):437-46. doi: 10.1007/s00335-009-9199-0. Epub 2009 Jul 17. Mamm Genome. 2009. PMID: 19609828 Free PMC article. - Genetic Architecture of Atherosclerosis in Mice: A Systems Genetics Analysis of Common Inbred Strains.
Bennett BJ, Davis RC, Civelek M, Orozco L, Wu J, Qi H, Pan C, Packard RR, Eskin E, Yan M, Kirchgessner T, Wang Z, Li X, Gregory JC, Hazen SL, Gargalovic PS, Lusis AJ. Bennett BJ, et al. PLoS Genet. 2015 Dec 22;11(12):e1005711. doi: 10.1371/journal.pgen.1005711. eCollection 2015 Dec. PLoS Genet. 2015. PMID: 26694027 Free PMC article. - Caspase-11 non-canonical inflammasome: a critical sensor of intracellular lipopolysaccharide in macrophage-mediated inflammatory responses.
Yi YS. Yi YS. Immunology. 2017 Oct;152(2):207-217. doi: 10.1111/imm.12787. Epub 2017 Jul 31. Immunology. 2017. PMID: 28695629 Free PMC article. Review. - A novel strategy for genetic dissection of complex traits: the population of specific chromosome substitution strains from laboratory and wild mice.
Xiao J, Liang Y, Li K, Zhou Y, Cai W, Zhou Y, Zhao Y, Xing Z, Chen G, Jin L. Xiao J, et al. Mamm Genome. 2010 Aug;21(7-8):370-6. doi: 10.1007/s00335-010-9270-x. Epub 2010 Jul 11. Mamm Genome. 2010. PMID: 20623355 Review.
Cited by
- A systems genetics approach reveals environment-dependent associations between SNPs, protein coexpression, and drought-related traits in maize.
Blein-Nicolas M, Negro SS, Balliau T, Welcker C, Cabrera-Bosquet L, Nicolas SD, Charcosset A, Zivy M. Blein-Nicolas M, et al. Genome Res. 2020 Nov;30(11):1593-1604. doi: 10.1101/gr.255224.119. Epub 2020 Oct 15. Genome Res. 2020. PMID: 33060172 Free PMC article. - Preservation Analysis of Macrophage Gene Coexpression Between Human and Mouse Identifies PARK2 as a Genetically Controlled Master Regulator of Oxidative Phosphorylation in Humans.
Codoni V, Blum Y, Civelek M, Proust C, Franzén O; Cardiogenics Consortium; IDEM Leducq Consortium CADGenomics; Björkegren JL, Le Goff W, Cambien F, Lusis AJ, Trégouët DA. Codoni V, et al. G3 (Bethesda). 2016 Oct 13;6(10):3361-3371. doi: 10.1534/g3.116.033894. G3 (Bethesda). 2016. PMID: 27558669 Free PMC article. - Gene-by-Sex Interactions in Mitochondrial Functions and Cardio-Metabolic Traits.
Norheim F, Hasin-Brumshtein Y, Vergnes L, Chella Krishnan K, Pan C, Seldin MM, Hui ST, Mehrabian M, Zhou Z, Gupta S, Parks BW, Walch A, Reue K, Hofmann SM, Arnold AP, Lusis AJ. Norheim F, et al. Cell Metab. 2019 Apr 2;29(4):932-949.e4. doi: 10.1016/j.cmet.2018.12.013. Epub 2019 Jan 10. Cell Metab. 2019. PMID: 30639359 Free PMC article. - Trimethylamine N-Oxide Promotes Vascular Inflammation Through Signaling of Mitogen-Activated Protein Kinase and Nuclear Factor-κB.
Seldin MM, Meng Y, Qi H, Zhu W, Wang Z, Hazen SL, Lusis AJ, Shih DM. Seldin MM, et al. J Am Heart Assoc. 2016 Feb 22;5(2):e002767. doi: 10.1161/JAHA.115.002767. J Am Heart Assoc. 2016. PMID: 26903003 Free PMC article. - The potential of integrating human and mouse discovery platforms to advance our understanding of cardiometabolic diseases.
Jurrjens AW, Seldin MM, Giles C, Meikle PJ, Drew BG, Calkin AC. Jurrjens AW, et al. Elife. 2023 Mar 31;12:e86139. doi: 10.7554/eLife.86139. Elife. 2023. PMID: 37000167 Free PMC article.
References
- Chinetti G, Zawadski C, Fruchart JC, Staels B. Expression of adiponectin receptors in human macrophages and regulation by agonists of the nuclear receptors PPARalpha, PPARgamma, LXR. Biochem Biophys Res Commun. 2004;314:151–158. - PubMed
- Edgel KA, Leboeuf RC, Oram JF. Tumor necrosis factor-alpha and lymphotoxin-alpha increase macrophage ABCA1 by gene expression and protein stabilization via different receptors. Atherosclerosis. 2010;209:387–392. - PubMed
Publication types
MeSH terms
Substances
Grants and funding
- T32-HG002536/HG/NHGRI NIH HHS/United States
- GM07104/GM/NIGMS NIH HHS/United States
- P01 HL028481/HL/NHLBI NIH HHS/United States
- 5F32DK074317/DK/NIDDK NIH HHS/United States
- T32 GM007104/GM/NIGMS NIH HHS/United States
- HL30568/HL/NHLBI NIH HHS/United States
- R01 AR057759/AR/NIAMS NIH HHS/United States
- P01 HL030568/HL/NHLBI NIH HHS/United States
- K99 HL102223/HL/NHLBI NIH HHS/United States
- R01 GM095656/GM/NIGMS NIH HHS/United States
- D094311/PHS HHS/United States
- HL28481/HL/NHLBI NIH HHS/United States
- T32 HG002536/HG/NHGRI NIH HHS/United States
- DP3 DK094311/DK/NIDDK NIH HHS/United States
- R00 HL102223/HL/NHLBI NIH HHS/United States
- F32 DK074317/DK/NIDDK NIH HHS/United States

