β2-syntrophin and Par-3 promote an apicobasal Rac activity gradient at cell-cell junctions by differentially regulating Tiam1 activity - PubMed (original) (raw)
. 2012 Nov;14(11):1169-80.
doi: 10.1038/ncb2608. Epub 2012 Oct 28.
Affiliations
- PMID: 23103911
- PMCID: PMC3498067
- DOI: 10.1038/ncb2608
β2-syntrophin and Par-3 promote an apicobasal Rac activity gradient at cell-cell junctions by differentially regulating Tiam1 activity
Natalie A Mack et al. Nat Cell Biol. 2012 Nov.
Abstract
Although Rac and its activator Tiam1 are known to stimulate cell-cell adhesion, the mechanisms regulating their activity in cell-cell junction formation are poorly understood. Here, we identify β2-syntrophin as a Tiam1 interactor required for optimal cell-cell adhesion. We show that during tight-junction (TJ) assembly β2-syntrophin promotes Tiam1-Rac activity, in contrast to the function of the apical determinant Par-3 whose inhibition of Tiam1-Rac activity is necessary for TJ assembly. We further demonstrate that β2-syntrophin localizes more basally than Par-3 at cell-cell junctions, thus generating an apicobasal Rac activity gradient at developing cell-cell junctions. Targeting active Rac to TJs shows that this gradient is required for optimal TJ assembly and apical lumen formation. Consistently, β2-syntrophin depletion perturbs Tiam1 and Rac localization at cell-cell junctions and causes defects in apical lumen formation. We conclude that β2-syntrophin and Par-3 fine-tune Rac activity along cell-cell junctions controlling TJ assembly and the establishment of apicobasal polarity.
Figures
Figure 1
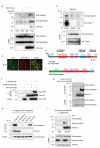
Tiam1 interacts with the β2-syntrophin PDZ domain using an internal PDZ-binding motif. (a) Exogenous Tiam1-myc expressed in HEK293T cells was immunoprecipitated with anti-myc antibody. Co-precipitated endogenous syntrophin and endogenous utrophin were detected by immunoblotting. (b) Endogenous Tiam1 from MDCKII cells was immunoprecipitated with anti-Tiam1 antibody and co-precipitated endogenous syntrophin was detected by immunoblotting. (c) MDCKII cells cultured in high calcium medium (HCM) were fixed and stained by immunofluorescence for Tiam1 and syntrophin. Scale bar represents 10 μm. (d) Schematic representation of the domain structure of full-length (FL) HA-tagged Tiam1 (FL-Tiam1-HA). Horizontal arrows indicate the various N-terminally truncated Tiam1-HA constructs used. Vertical arrow indicates where the internal KETDI PDZ binding motif (PBM) is approximately located. Myr, myristoylation site; PEST, motif rich in Proline (P), Glutamic acid (E), Serine (S), and Threonine (T); PHn-CC-EX, N-terminal pleckstrin homology, coiled-coil, extended structure; RBD, Ras binding domain; PDZ, PSD-95/Dlg1/ZO-1; DH, Dbl homology; PHc, C-terminal pleckstrin homology; HA, hemagglutinin tag. (e) Schematic representation of the domain structure of GFP-β2-syntrophin. GFP, green fluorescent protein tag; SU, Syntrophin Unique domain; PH1a and PH1b, split pleckstrin homology domain; PH2, second pleckstrin homology domain. (f) Tiam1-C196-HA-WT and Tiam1-C196-HA-ΔKETDI were transfected into HEK293T cells with the GFP-tagged PDZ domain of β2-syntrophin (GFP-Syn-PDZ). The exogenous Tiam1 fragments were immunoprecipitated with anti-HA antibody and co-precipitated GFP-Syn-PDZ was detected by immunoblotting. (g) Tiam1-HA-WT or Tiam1-HA-ΔKETDI were expressed in HEK293T cells and immunoprecipitated with anti-HA antibody. Co-precipitated endogenous syntrophin and utrophin were detected by immunoblotting. (h) The indicated HA-tagged Tiam1 fragment constructs were expressed in HEK293T cells and immunoprecipitated with anti-HA antibody. Co-precipitated endogenous syntrophin was detected by immunoblotting with anti-syntrophin antibody. (i) Tiam1-HA was immunoprecipitated from MDCKII cells which were also engineered to express shRNA targeting β2-syntrophin (β2-syntrophin RNAi#1) following addition of doxycycline (+ dox). Co-precipitated endogenous syntrophin and utrophin were detected by immunoblotting. All data shown are representative of at least three independent experiments. IP, indicates immunoprecipitation. Uncropped images of blots are shown in Supplementary Information, Fig. S9.
Figure 2
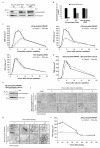
β2-syntrophin regulates TJ assembly in MDCKII cells. (a) MDCKII cells with doxycycline-inducible expression of one of two separate shRNAs targeting β2-syntrophin (β2-syntrophin RNAi#1, #2) or a non-targeting control shRNA (Non-targeting RNAi) were treated with (+) or without (-) doxycycline (dox) where indicated. Levels of syntrophin and Tubulin were detected by immunoblotting. A representative immunoblot is shown. (b) Graph quantifying β2-syntrophin knockdown, n=3. (c) Calcium switch (CS) TER readings from β2-syntrophin RNAi#1, #2 or Non-targeting RNAi MDCKII cells treated with (Plus dox) or without (Control) dox, n=3. (d) CS TER readings from β2-syntrophin RNAi#1 MDCKII cells expressing shRNA-resistant β2-syntrophin (β2-syntrophin-rescue) treated with (Plus dox) or without (Control) dox, n=3. (e) Immunoblot showing syntrophin levels in β2-syntrophin RNAi#1 cells expressing β2-syntrophin-rescue treated with (+) or without (-) dox. Actin is used as a loading control. (f) β2-syntrophin RNAi#1 MDCKII cells treated with (Plus dox) or without (Control) dox were fixed from high calcium medium (HCM), or at the indicated CS time-points, and stained by immunofluorescence for occludin. Panels show representative images from one of three independent experiments. (g) β2-syntrophin RNAi#1 MDCKII cells treated with (Plus dox) or without (Control) dox were fixed at the indicated time-points after plating and stained by immunofluorescence for occludin. Panels show representative images from one of three independent experiments. (h) TER readings from β2-syntrophin RNAi#1 MDCKII cells treated with (Plus dox) or without (Control) dox at the indicated time-points after plating, n=3. n represents number of independent experiments. Results in b, c, d and h represent mean values±s.e.m for the indicated number of independent experiments. Scale bars represent 30 μm. Uncropped images of blots are shown in Supplementary Information, Fig. S9.
Figure 3
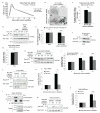
Tiam1-induced Rac activity impedes TJ assembly in MDCKII cells. (a) CS TER readings for MDCKII cells inducibly expressing a Tiam1 shRNA (Tiam1 RNAi#1) treated with (Plus dox) or without (Control) dox for 7 days (short dox), n=3. (b) Representative immunoblot showing the extent of Tiam1 knockdown for cells in (a). Actin was used as a loading control. (c) As for (a) but cells treated with (Plus dox) or without (Control) dox for 3 weeks (long dox), n=3. (d) Representative immunoblot showing the extent of Tiam1 knockdown for cells in (c). Tubulin was used as a loading control. (e) CS TER readings for MDCKII cells inducibly over-expressing Tiam1-HA-WT (TetOn-Tiam1-HA-WT) treated with (Plus dox) or without (Control) dox, n=3. (f) Representative images of TetOn-Tiam1-HA-WT MDCKII cells treated with (Plus dox) or without (Control) dox fixed 60 min after CS and stained by immunofluorescence for occludin and HA. (g) Graph showing average number of intact junctions as a ratio of total cell number, n=4. t-test: ** P<0.005. (h) CS TER readings for MDCKII cells inducibly over-expressing Tiam1-HA-DH* (TetOn-Tiam1-HA-DH*) treated with (Plus dox) or without (Control) dox, n=4. (i) Representative images of TetOn-Tiam1-HA-DH* MDCKII cells treated with (Plus dox) or without (Control) dox fixed 15 and 60 min after CS and stained by immunofluorescence for occludin and HA. (j) Graph showing average number of intact junctions as a ratio of total cell number, n=3. t-test: 15 min * P<0.05, 60 min P=0.310 (ns). n represents number of independent experiments. ns indicates no significant difference. Results in a, c, e, g, h and j represent mean values±s.e.m for the indicated number of independent experiments. Scale bars represent 30 μm. Uncropped images of blots are shown in Supplementary Information, Fig. S9.
Figure 4
β2-syntrophin promotes Tiam1-Rac activity during TJ assembly. (a-c) MDCKII cells inducibly over-expressing Tiam1-HA-ΔKETDI (TetOn-Tiam1-HA-ΔKETDI) were treated with (Plus dox) or without (Control) dox. (a) Calcium switch (CS) TER readings, n=3. The dotted line represents the TER peak from dox-treated TetOn-Tiam1-HA-WT cells normalised to that of control TetOn-Tiam1-HA-ΔKETDI cells. (b) Representative images of cells fixed 60 min after CS and stained by immunofluorescence for occludin and HA. (c) Graph showing average number of intact junctions as a ratio of total cell number, n=3. t-test: P=0.223 (ns). (d) Dox-treated confluent TetOn-Tiam1-HA-WT, TetOn-Tiam1-HA-ΔKETDI and TetOn-Tiam1-HA-DH* cells were maintained in high calcium medium (HCM) or subjected to 60 min CS and subsequently lysed and assayed for Rac activity. (e) Quantification of (d), n=5. t-test: HCM P=0.938 (ns), 60 min switch ** P<0.005. (f-i) Confluent β2-syntrophin RNAi#1 cells were treated with (+ or plus dox) or without (- or control) dox. (f) Immunoblot from cells maintained in HCM and subsequently lysed and assayed for Rac activity. (g) Quantification of (f), n=3. Paired t-test: P=0.381 (ns). (h) Immunoblot from cells subjected to 0, 30 or 60 min CS and subsequently lysed and assayed for Rac activity. (i) Quantification of (h), n=5. Paired t-test: 30 min * P<0.05, 60 min ** P<0.005. (j) Immunoblot from confluent Tiam1 RNAi cells treated with (Plus dox) or without (Control) dox, subjected to 0 or 60 min CS and subsequently lysed and assayed for Rac activity. (k) Quantification of (j), n=3. t-test: * P<0.05. (l-n) TetOn-KETDI-44 cells were treated with (+) or without (-) dox. (l) Endogenous Tiam1 was immunoprecipitated with anti-Tiam1 antibody and co-precipitated endogenous syntrophin was detected by immunoblotting with anti-syntrophin antibody. (m) Immunoblot from cells subjected to 0 or 60 min CS and subsequently lysed and assayed for Rac activity. (n) Quantification of (m), n=3. t-test: 60 min ** P<0.005. n represents number of independent experiments. ns indicates no significant difference. Results in a, c, e, g, i, k and n represent mean values±s.e.m for the indicated number of independent experiments. Scale bars represent 30 μm. Uncropped images of blots are shown in Supplementary Information, Fig. S9.
Figure 5
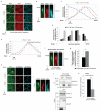
β2-syntrophin, Par-3 and Tiam1 localise differently along the apicobasal junctional axis. (a-g) β2-syntrophin RNAi#1 MDCKII cells treated with (β2-syntrophin knockdown) or without (Control) dox were subjected to 6 hours calcium switch (CS) and then fixed and stained with anti-Par-3, anti-Tiam1 and anti-syntrophin antibodies. (a) Representative images of Control cells in the x/y planes at three different z-steps with 1.2 μm separation. (b) Images of Par-3, Tiam1 and Syntrophin stainings in the x/z plane at a cross-section along the junction highlighted in (a) by a white arrow. (c) Quantification of Par-3, Tiam1 and Syntrophin staining intensities (normalised to their own maximal intensity) at the junction shown in (b). (d) A representative experiment quantifying average staining intensities for Par-3, Tiam1 and Syntrophin (normalised to their own maximal intensity) from individual junctions of control cells at four junctional positions (1 μm apart on the z-axis). (e) Quantification of Par-3 and Tiam1 staining intensities (normalised to their own maximal intensity) at a representative junction from a β2-syntrophin knockdown cell. (f) Images of Par-3, Tiam1 and Syntrophin stainings in the x/z plane at a cross-section along the junction quantified in (e). (g) Quantification of Tiam1 staining intensities at apical junction positions (where Par-3 staining intensity was closest to 0.8) of individual junctions in control and β2-syntrophin knockdown cells, n=3. t-test: * P<0.05. (h) MDCKII cells fixed and stained with anti-Par-3, anti-E-cadherin and anti-syntrophin antibodies 6 hours after CS. Representative images are shown in the x/y planes at three different z-steps with 1.2 μm separation. (i) Images of the x/z plane at a cross-section along the junction highlighted in (h) by a white arrow. (j) Endogenous Tiam1 was immunoprecipitated from GFP-alone or GFP-β2-syntrophin over-expressing MDCKII cells 6 hours after CS with anti-Tiam1 antibody and co-precipitated endogenous Par-3 was detected by immunoblotting with anti-Par-3 antibody. (k) Quantification of (j), n=3, t-test: ** P<0.005. n represents number of independent experiments. Results in g and k represent mean values±s.e.m for the indicated number of independent experiments. Scale bars represent 10 μm. Syn, Syntrophin. Uncropped images of blots are shown in Supplementary Information, Fig. S9.
Figure 6
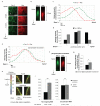
An apicobasal Rac activity gradient at cell-cell junctions. (a-g) β2-syntrophin RNAi#1 MDCKII cells treated with (β2-syntrophin knockdown) or without (Control) dox subjected to 3 hours calcium switch (CS), were fixed and stained with anti-Par-3 and anti-Rac antibodies. (a) Representative images of Control cells in the x/y planes at three different z-steps with 1.0 μm separation. (b) Images of Par-3 and Rac stainings in the x/z plane at a cross-section along the junction highlighted in (a) by a white arrow. (c) Quantification of Par-3 and Rac staining intensities (normalised to their own maximal intensity) at the junction shown in (b). (d) A representative experiment quantifying average staining intensities for Par-3 and Rac (normalised to their own maximal intensity) from individual junctions of control cells at three junctional positions (1 μm apart on the z-axis). (e) Quantification of Par-3 and Rac staining intensities (normalised to their own maximal intensity) at a representative junction from a β2-syntrophin knockdown cell. (f) Images of Par-3 and Rac stainings in the x/z plane at a cross-section along the junction quantified in (e). (g) Quantification of Rac staining intensities at apical junction positions (where Par-3 staining intensity was closest to 0.8) of individual junctions in control and β2-syntrophin knockdown cells, n=3. Paired t-test: * P<0.05. (h, i) FLIM-FRET analysis of Non-targeting or β2-syntrophin RNAi Raichu-Rac MDCKII cells 6 hours after CS. (h) Representative lifetime images in the x/y plane at apical and subapical junctional positions. Fluorescence lifetimes of GFP are shown in false colours. Red indicates high lifetime (inactive), yellow/green indicates low lifetime (active). (i) Average fluorescence lifetimes found at subapical and apical junctional positions, n=3. Paired t-test: Non-targeting RNAi ** P<0.005, β2-syntrophin RNAi P=0.094 (ns). n represents number of independent experiments. ns indicates no significant difference. Results in g and i represent mean values±s.e.m. for the indicated number of independent experiments. Scale bars represent 10 μm.
Figure 7
The cell-cell junction Rac activity gradient promotes TJ assembly and apicobasal polarity. (a) Schematic representation of the GBP-GFP system used to target GFP-tagged proteins to TJs. GBP, GFP binding protein. (b-e) MDCKII cell lines expressing either GBP-Pk-occludin, GFP-Rac1-V12, GBP-Pk-occludin and GFP, GBP-Pk-occludin and GFP-Rac1-V12 or GBP-Pk-occludin and GFP-Rac1-WT, were generated. (b) Representative images of cell lines indicated, fixed and stained with anti-GFP and anti-Pk antibodies. The images shown are from a single z-section. Scale bar represents 30 μm. (c) CS TER readings: GBP-occludin (n=4), GFP-Rac1-V12 (n=6), GBP-occludin+GFP (n=9), GBP-occludin+GFP-Rac1-V12 (n=7) and GBP-occludin+GFP-Rac1-WT (n=3). (d) Images showing single cross-sections of representative cysts of GBP-occludin+GFP, GBP-occludin+GFP-Rac1-V12 or GBP-occludin+GFP-Rac1-WT expressing MDCKII cells grown in collagen I matrix and stained for Actin (red, left panel), Gp135 (green, middle panel) as an apical marker, and Hoechst (blue, right panel) to show nuclei. Scale bar represents 10 μm. (e) Quantification of abnormal cysts from (d), n=3. The total number of cysts analysed for each cell line is shown. Paired t-test: GFP control vs. Rac1-WT P=0.572 (ns), GFP control vs. Rac1-V12 * P<0.05. n represents number of independent experiments. ns indicates no significant difference. Results in c and e represent mean values±s.e.m for the indicated number of independent experiments.
Figure 8
β2-syntrophin promotes apicobasal polarity. (a) Images show single cross-sections of representative cysts of β2-syntrophin RNAi#1, #2, or Non-targeting RNAi MDCKII cells treated with dox and stained for Actin (red, left panel), Gp135 (green, middle panel), and Hoechst (blue, right panel). (b) Quantification of (a) and Supplementary Information, Fig. S8a, n=3. The total number of cysts analysed is shown. Paired t-test: β2-syntrophin RNAi#1 * P<0.05, β2-syntrophin RNAi#2 ** P<0.005, Non-targeting RNAi P=0.600 (ns). (c) Model depicting the differential localisations of Par-3 and β2-syntrophin and their differential effects on Tiam1-Rac activity at cell-cell junctions. (d) Model depicting the differential but overlapping localisations of β2-syntrophin, Par-3, Tiam1 and Rac at cell-cell junctions, which enable them to promote an apicobasal junctional Rac activity gradient. β2-syn, β2-syntrophin. n represents number of independent experiments. Results in b represent mean values±s.e.m for the indicated number of independent experiments. Scale bar represents 10 μm.
Similar articles
- The Rac activator Tiam1 controls tight junction biogenesis in keratinocytes through binding to and activation of the Par polarity complex.
Mertens AE, Rygiel TP, Olivo C, van der Kammen R, Collard JG. Mertens AE, et al. J Cell Biol. 2005 Sep 26;170(7):1029-37. doi: 10.1083/jcb.200502129. J Cell Biol. 2005. PMID: 16186252 Free PMC article. - The interdependence of the Rho GTPases and apicobasal cell polarity.
Mack NA, Georgiou M. Mack NA, et al. Small GTPases. 2014;5(2):10. doi: 10.4161/21541248.2014.973768. Small GTPases. 2014. PMID: 25469537 Free PMC article. Review. - Par-3 controls tight junction assembly through the Rac exchange factor Tiam1.
Chen X, Macara IG. Chen X, et al. Nat Cell Biol. 2005 Mar;7(3):262-9. doi: 10.1038/ncb1226. Epub 2005 Feb 20. Nat Cell Biol. 2005. PMID: 15723052 - PAR-6-PAR-3 mediates Cdc42-induced Rac activation through the Rac GEFs STEF/Tiam1.
Nishimura T, Yamaguchi T, Kato K, Yoshizawa M, Nabeshima Y, Ohno S, Hoshino M, Kaibuchi K. Nishimura T, et al. Nat Cell Biol. 2005 Mar;7(3):270-7. doi: 10.1038/ncb1227. Epub 2005 Feb 20. Nat Cell Biol. 2005. PMID: 15723051 - Tiam1 takes PARt in cell polarity.
Mertens AE, Pegtel DM, Collard JG. Mertens AE, et al. Trends Cell Biol. 2006 Jun;16(6):308-16. doi: 10.1016/j.tcb.2006.04.001. Epub 2006 May 2. Trends Cell Biol. 2006. PMID: 16650994 Review.
Cited by
- Par3 controls neural crest migration by promoting microtubule catastrophe during contact inhibition of locomotion.
Moore R, Theveneau E, Pozzi S, Alexandre P, Richardson J, Merks A, Parsons M, Kashef J, Linker C, Mayor R. Moore R, et al. Development. 2013 Dec;140(23):4763-75. doi: 10.1242/dev.098509. Epub 2013 Oct 30. Development. 2013. PMID: 24173803 Free PMC article. - Cancer cell-autonomous TRAIL-R signaling promotes KRAS-driven cancer progression, invasion, and metastasis.
von Karstedt S, Conti A, Nobis M, Montinaro A, Hartwig T, Lemke J, Legler K, Annewanter F, Campbell AD, Taraborrelli L, Grosse-Wilde A, Coy JF, El-Bahrawy MA, Bergmann F, Koschny R, Werner J, Ganten TM, Schweiger T, Hoetzenecker K, Kenessey I, Hegedüs B, Bergmann M, Hauser C, Egberts JH, Becker T, Röcken C, Kalthoff H, Trauzold A, Anderson KI, Sansom OJ, Walczak H. von Karstedt S, et al. Cancer Cell. 2015 Apr 13;27(4):561-73. doi: 10.1016/j.ccell.2015.02.014. Epub 2015 Apr 2. Cancer Cell. 2015. PMID: 25843002 Free PMC article. - Compartmentalized, functional role of angiogenin during spotted fever group rickettsia-induced endothelial barrier dysfunction: evidence of possible mediation by host tRNA-derived small noncoding RNAs.
Gong B, Lee YS, Lee I, Shelite TR, Kunkeaw N, Xu G, Lee K, Jeon SH, Johnson BH, Chang Q, Ha T, Mendell NL, Cheng X, Bouyer DH, Boor PJ, Ksiazek TG, Walker DH. Gong B, et al. BMC Infect Dis. 2013 Jun 23;13:285. doi: 10.1186/1471-2334-13-285. BMC Infect Dis. 2013. PMID: 23800282 Free PMC article. - Cdk1 phosphorylates the Rac activator Tiam1 to activate centrosomal Pak and promote mitotic spindle formation.
Whalley HJ, Porter AP, Diamantopoulou Z, White GR, Castañeda-Saucedo E, Malliri A. Whalley HJ, et al. Nat Commun. 2015 Jun 16;6:7437. doi: 10.1038/ncomms8437. Nat Commun. 2015. PMID: 26078008 Free PMC article. - RhoGTPases, actomyosin signaling and regulation of the epithelial Apical Junctional Complex.
Quiros M, Nusrat A. Quiros M, et al. Semin Cell Dev Biol. 2014 Dec;36:194-203. doi: 10.1016/j.semcdb.2014.09.003. Epub 2014 Sep 16. Semin Cell Dev Biol. 2014. PMID: 25223584 Free PMC article. Review.
References
- Matter K, Aijaz S, Tsapara A, Balda MS. Mammalian tight junctions in the regulation of epithelial differentiation and proliferation. Curr Opin Cell Biol. 2005;17:453–8. - PubMed
- Steed E, Balda MS, Matter K. Dynamics and functions of tight junctions. Trends Cell Biol. 2010;20:142–9. - PubMed
- Assemat E, Bazellieres E, Pallesi-Pocachard E, Le Bivic A, Massey-Harroche D. Polarity complex proteins. Biochim Biophys Acta. 2008;1778:614–30. - PubMed
- McCaffrey LM, Macara IG. Epithelial organization, cell polarity and tumorigenesis. Trends Cell Biol. 2011;21:727–35. - PubMed
MeSH terms
Substances
Grants and funding
- 12937/CRUK_/Cancer Research UK/United Kingdom
- 15565/CRUK_/Cancer Research UK/United Kingdom
- A5294/CRUK_/Cancer Research UK/United Kingdom
- MR/J00104X/1/MRC_/Medical Research Council/United Kingdom
LinkOut - more resources
Full Text Sources
Molecular Biology Databases
Miscellaneous
