Mechanistic and structural insight into the functional dichotomy between IL-2 and IL-15 - PubMed (original) (raw)
. 2012 Dec;13(12):1187-95.
doi: 10.1038/ni.2449. Epub 2012 Oct 28.
Jian-Xin Lin, Dan Feng, Suman Mitra, Mathias Rickert, Gregory R Bowman, Vijay S Pande, Peng Li, Ignacio Moraga, Rosanne Spolski, Engin Ozkan, Warren J Leonard, K Christopher Garcia
Affiliations
- PMID: 23104097
- PMCID: PMC3501574
- DOI: 10.1038/ni.2449
Mechanistic and structural insight into the functional dichotomy between IL-2 and IL-15
Aaron M Ring et al. Nat Immunol. 2012 Dec.
Abstract
Interleukin 15 (IL-15) and IL-2 have distinct immunological functions even though both signal through the receptor subunit IL-2Rβ and the common γ-chain (γ(c)). Here we found that in the structure of the IL-15-IL-15Rα-IL-2Rβ-γ(c) quaternary complex, IL-15 binds to IL-2Rβ and γ(c) in a heterodimer nearly indistinguishable from that of the IL-2-IL-2Rα-IL-2Rβ-γ(c) complex, despite their different receptor-binding chemistries. IL-15Rα substantially increased the affinity of IL-15 for IL-2Rβ, and this allostery was required for IL-15 trans signaling. Consistent with their identical IL-2Rβ-γ(c) dimer geometries, IL-2 and IL-15 showed similar signaling properties in lymphocytes, with any differences resulting from disparate receptor affinities. Thus, IL-15 and IL-2 induced similar signals, and the cytokine specificity of IL-2Rα versus IL-15Rα determined cellular responsiveness. Our results provide new insights for the development of specific immunotherapeutics based on IL-15 or IL-2.
Figures
Figure 1
The crystal structure of the quaternary IL-15 receptor complex. (a) Front (left) and top (right) views of the IL-15 quaternary receptor complex comprised of IL-15 (green), IL-15Rα (cyan), IL-2Rβ (blue), and γc (gold). The “site I” and “site II” interactions between IL-15 and IL-2Rβ and γc, respectively, are indicated. (b) The structure of the IL-2 quaternary complex (PDB code 2B5i; left) and the superimposition of the IL-15 and IL-2 receptor complexes (right). The IL-15 and IL-2 complexes superimpose with an r.m.s.d of 1.175Å)
Figure 2
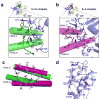
Comparison of the IL-15 and IL-2 site I interfaces. (a) The site I interface of IL-15 (green cylinders and side chains) contacting IL-2Rβ (blue loops and side chains). (b) The site I interface of IL-2 (magenta cylinders and side chains) contacting IL-2Rβ (blue loops and side chains). (c) Superimposition of the IL-15 (green) and IL-2 (magenta) A and C helices showing structural conservation of D61, N65, and D8 of IL-15. (d) Superposition of IL-2Rβ bound to IL-15 (light blue) and IL-2 (blue) indicating the apparent rigidity of the interface in binding two distinct cytokines.
Figure 3
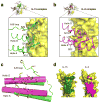
Comparison of the IL-15 and IL-2 site II interfaces. (a) The site II interface of IL-15 (green tubes and side chains) binding to γc (yellow surface). X-SCID associated Y103 on γc is depicted in dark yellow. (b) The site II interface of IL-2 (magenta tubes and side chains) binding to γc (yellow surface). (c) Superimposition of the IL-15 (green) and IL-2 (magenta) A and D helices. Only Q108 and I111 of IL-15 are strictly conserved at the interface. (d) Comparison of γc binding interfaces. The surface of γc, shaded according to binding to IL-15 (left; dark green) or IL-2 (right; magenta). Note the increased contact area between IL-15 and γc, particularly in the upper part of the receptor.
Figure 4
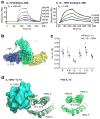
Enhancement of IL-15—IL-2Rβ interaction by IL-15Rα. (a) SPR sensorgrams of IL-2Rβ binding to free IL-15 (left) or IL-15—IL-15Rα complexes (right) demonstrate IL-15—IL-15Rα complexes bind to IL-2Rβ with higher affinity (3 nM) relative to free IL-15 cytokine (438 nM). (b) Top view of the IL-15 quaternary complex indicating the lack of contact between IL-2Rβ and IL-15Rα. (c) A 65 ns molecular dynamics simulation shows a global reduction of the r.m.s.d. for each indicated structural element (assignments indicated in Supplementary Table 1) of IL-15 upon binding IL-15Rα. Error bars represent the standard error of r.m.s.d. (d) The five most highly-populated states of IL-15 bound to IL-15Rα (left) and free IL-15 (right) indicate the subtle global stabilization upon binding IL-15Rα.
Figure 5
Signaling analysis of IL-2 and IL-15 in YT-1 human NK cells. The phospho-STAT5 dose-response relationships for IL-2 (magneta circles), the “superkine” H9 (orange squares), IL-15 (light green upward triangles), and IL-15—IL-15Rα complexes (dark green downward triangles) are shown for IL-2Rα− and IL-2Rα+ YT cells (top left and right, respectively). Signaling kinetics relationships for phospho-STAT5 (2nd row), phospho-ERK1/2 (3rd row), and IL-2Rβ receptor internalization (4th row) were determined at saturating (500 nM) and subsaturating (1 nM) concentrations (boxed columns). Differences in signaling amplitude and kinetics are concentration-dependent as cytokine signaling profiles converge at saturating concentrations. Error bars represent standard error of mean fluorescence intensity of samples in triplicate
Figure 6
Signaling analysis of IL-2 and IL-15 in primary mouse CD8 cells. As in Fig. 5, phospho-STAT5 dose-response relationships for IL-2 (magneta circles), H9 (orange squares), IL-15 (light green upward triangles), and IL-15—IL-15Rα complexes (dark green downward triangles) are shown for freshly-isolated CD8 T cells and CD8 T cells ‘pre-activated’ with anti-CD3 antibody. ‘Pre-activated’ cells express significantly higher levels of IL-2Rα and IL-15Rα than freshly-isolated cells (Supplementary Fig. 3b). Signaling kinetics relationships for phospho-STAT5 (2nd row) and phospho-S6kinase (3rd row) were determined at saturating (500 nM) and subsaturating (1 nM) concentrations (boxed columns). Similar to the effect of the cytokines in YT-1 cells, signaling amplitude and kinetics were readily predicted by the respective point where each cytokine resided on its dose-response relationship (top row). Error bars represent standard error of mean fluorescence intensity of samples in duplicate.
Figure 7
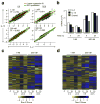
RNA-seq analysis of gene transcription regulated by IL-2 and IL-15. (a) Correlations in fold changes (log2) of IL-2 and IL-15 regulated genes. 95% confidence intervals are not shown as they almost overlap with the 95% prediction from the linear regression fit. (b) Bar graphs showing the numbers of genes that are regulated by IL-2 or IL-15 at the indicated times and concentrations. (c) and (d) Heatmaps showing genes that are preferentially regulated by (c) IL-2 or (d) IL-15. Expression of each gene is normalized to the same range [-2, 2] for color display.
Figure 8
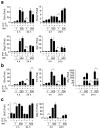
qPCR validation of differentially regulated IL-2 and IL-15 target genes. (a) IL-2 and IL-15 induced expression of the indicated genes at 1 and 500 nM, at 4 and 24 hr time points. (b) Examples of genes more induced by IL-2 than IL-15 even at high dose. (c) Genes that are preferentially induced by IL-15 at low dose but similarly induced by IL-2 and IL-15 at high dose. The cDNA inputs were normalized based on the ΔCt values of Rpl7 primers. Shown are the relative expression levels of triplicate samples of a representative experiment. * p ≤ 0.05, ** p ≤ 0.01, and *** p ≤ 0.001.
Comment in
- IL-2 and IL-15 signaling complexes: different but the same.
Ikemizu S, Chirifu M, Davis SJ. Ikemizu S, et al. Nat Immunol. 2012 Dec;13(12):1141-2. doi: 10.1038/ni.2472. Nat Immunol. 2012. PMID: 23160210 No abstract available.
Similar articles
- Crystal Structure of the interleukin-15.interleukin-15 receptor alpha complex: insights into trans and cis presentation.
Olsen SK, Ota N, Kishishita S, Kukimoto-Niino M, Murayama K, Uchiyama H, Toyama M, Terada T, Shirouzu M, Kanagawa O, Yokoyama S. Olsen SK, et al. J Biol Chem. 2007 Dec 21;282(51):37191-204. doi: 10.1074/jbc.M706150200. Epub 2007 Oct 18. J Biol Chem. 2007. PMID: 17947230 - Mechanistic and Structural Insights on the IL-15 System through Molecular Dynamics Simulations.
Sousa RP, Laurent AD, Quéméner A, Mortier E, Questel JL. Sousa RP, et al. Molecules. 2019 Sep 6;24(18):3261. doi: 10.3390/molecules24183261. Molecules. 2019. PMID: 31500206 Free PMC article. - Exploiting a natural conformational switch to engineer an interleukin-2 'superkine'.
Levin AM, Bates DL, Ring AM, Krieg C, Lin JT, Su L, Moraga I, Raeber ME, Bowman GR, Novick P, Pande VS, Fathman CG, Boyman O, Garcia KC. Levin AM, et al. Nature. 2012 Mar 25;484(7395):529-33. doi: 10.1038/nature10975. Nature. 2012. PMID: 22446627 Free PMC article. - Increasing the biological activity of IL-2 and IL-15 through complexing with anti-IL-2 mAbs and IL-15Rα-Fc chimera.
Votavova P, Tomala J, Kovar M. Votavova P, et al. Immunol Lett. 2014 May-Jun;159(1-2):1-10. doi: 10.1016/j.imlet.2014.01.017. Epub 2014 Feb 7. Immunol Lett. 2014. PMID: 24512738 Review. - The soluble IL-2 receptor α/CD25 as a modulator of IL-2 function.
Lokau J, Petasch LM, Garbers C. Lokau J, et al. Immunology. 2024 Mar;171(3):377-387. doi: 10.1111/imm.13723. Epub 2023 Nov 30. Immunology. 2024. PMID: 38037265 Review.
Cited by
- Human Vγ9Vδ2 T cell expansion and their cytotoxic responses against cholangiocarcinoma.
Sawaisorn P, Gaballa A, Saimuang K, Leepiyasakulchai C, Lertjuthaporn S, Hongeng S, Uhlin M, Jangpatarapongsa K. Sawaisorn P, et al. Sci Rep. 2024 Jan 14;14(1):1291. doi: 10.1038/s41598-024-51794-1. Sci Rep. 2024. PMID: 38221530 Free PMC article. - Facile discovery of surrogate cytokine agonists.
Yen M, Ren J, Liu Q, Glassman CR, Sheahan TP, Picton LK, Moreira FR, Rustagi A, Jude KM, Zhao X, Blish CA, Baric RS, Su LL, Garcia KC. Yen M, et al. Cell. 2022 Apr 14;185(8):1414-1430.e19. doi: 10.1016/j.cell.2022.02.025. Epub 2022 Mar 23. Cell. 2022. PMID: 35325595 Free PMC article. - Constitutive Turbodomains enhance expansion and antitumor activity of allogeneic BCMA CAR T cells in preclinical models.
Lin RJ, Sutton J, Bentley T, Vargas-Inchaustegui DA, Nguyen D, Cheng HY, Yoon H, Van Blarcom TJ, Sasu BJ, Panowski SH, Sommer C. Lin RJ, et al. Sci Adv. 2023 Aug 4;9(31):eadg8694. doi: 10.1126/sciadv.adg8694. Epub 2023 Aug 4. Sci Adv. 2023. PMID: 37540748 Free PMC article. - Molecular pathways: interleukin-15 signaling in health and in cancer.
Mishra A, Sullivan L, Caligiuri MA. Mishra A, et al. Clin Cancer Res. 2014 Apr 15;20(8):2044-50. doi: 10.1158/1078-0432.CCR-12-3603. Clin Cancer Res. 2014. PMID: 24737791 Free PMC article. Review. - New interleukin-15 superagonist (IL-15SA) significantly enhances graft-versus-tumor activity.
Bailey CP, Budak-Alpdogan T, Sauter CT, Panis MM, Buyukgoz C, Jeng EK, Wong HC, Flomenberg N, Alpdogan O. Bailey CP, et al. Oncotarget. 2017 Jul 4;8(27):44366-44378. doi: 10.18632/oncotarget.17875. Oncotarget. 2017. PMID: 28574833 Free PMC article.
References
- Waldmann TA. The biology of interleukin-2 and interleukin-15: implications for cancer therapy and vaccine design. Nat Rev Immunol. 2006;6:595–601. - PubMed
Publication types
MeSH terms
Substances
Grants and funding
- R01 AI51321/AI/NIAID NIH HHS/United States
- T32 GM007365/GM/NIGMS NIH HHS/United States
- F30DK094541/DK/NIDDK NIH HHS/United States
- F30 DK094541/DK/NIDDK NIH HHS/United States
- R01 GM062868/GM/NIGMS NIH HHS/United States
- R37 AI051321/AI/NIAID NIH HHS/United States
- ImNIH/Intramural NIH HHS/United States
- R01 AI051321/AI/NIAID NIH HHS/United States
- HHMI/Howard Hughes Medical Institute/United States
LinkOut - more resources
Full Text Sources
Other Literature Sources
Molecular Biology Databases

