Influence of threonine metabolism on S-adenosylmethionine and histone methylation - PubMed (original) (raw)
. 2013 Jan 11;339(6116):222-6.
doi: 10.1126/science.1226603. Epub 2012 Nov 1.
Jason W Locasale, Costas A Lyssiotis, Yuxiang Zheng, Ren Yi Teo, Sutheera Ratanasirintrawoot, Jin Zhang, Tamer Onder, Juli J Unternaehrer, Hao Zhu, John M Asara, George Q Daley, Lewis C Cantley
Affiliations
- PMID: 23118012
- PMCID: PMC3652341
- DOI: 10.1126/science.1226603
Influence of threonine metabolism on S-adenosylmethionine and histone methylation
Ng Shyh-Chang et al. Science. 2013.
Abstract
Threonine is the only amino acid critically required for the pluripotency of mouse embryonic stem cells (mESCs), but the detailed mechanism remains unclear. We found that threonine and S-adenosylmethionine (SAM) metabolism are coupled in pluripotent stem cells, resulting in regulation of histone methylation. Isotope labeling of mESCs revealed that threonine provides a substantial fraction of both the cellular glycine and the acetyl-coenzyme A (CoA) needed for SAM synthesis. Depletion of threonine from the culture medium or threonine dehydrogenase (Tdh) from mESCs decreased accumulation of SAM and decreased trimethylation of histone H3 lysine 4 (H3K4me3), leading to slowed growth and increased differentiation. Thus, abundance of SAM appears to influence H3K4me3, providing a possible mechanism by which modulation of a metabolic pathway might influence stem cell fate.
Figures
Fig. 1. Thr-SAM pathway is activated by pluripotency factors
Heat map showing relative abundance of metabolites in iOSKM-MEFs in the absence of doxycycline treatment (no dox), 4 days after dox (dox 4D), 18 days after dox whereupon iPSC clones are fully reprogrammed (dox 18D), and mESCs, normalized to total biomass (n=3), and measured using selected reaction monitoring (SRM) and LC-MS/MS. (B) Scatter plot of metabolite intensities in mESCs (x-axis) vs. iPSCs (y-axis). Metabolite intensities were obtained from the integrated total ion current from a single SRM transition. (C) SRM analysis of abundance in glycolytic intermediates in iOSKM-MEFs during reprogramming (n=3). **P< 0.01, * P< 0.05. (D) SRM analysis of abundance in Thr-SAM pathway intermediates in iOSKM-MEFs during reprogramming (n=3). ** P< 0.01. (E) SRM analysis of abundance in Thr-SAM pathway intermediates in iLet-7 and iLin28a mESCs after dox (n=3). All error bars represent the s.e.m. from three independent measurements.
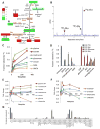
Fig. 2. Thr is catabolized to maintain the SAM/SAH ratio in mESCs
(A) Schematic of Thr-SAM pathway activity in pluripotent stem cells, relative to MEFs. (B) HPLC analysis of 14C-labeled amino acids derived from [U-14C]Thr in mESCs after 24h. Scintillation counts per minute (CPM) are plotted against retention time. (C) Fraction of intracellular metabolites derived from [U-13C]Thr in mESCs over 5h, as measured by SRM analysis (n=3). (D) Steady-state fraction of intracellular metabolites derived from [U-13C]Thr, [U-13C]Ser, [U-13C]-glucose, or [U-13C]Gln in mESCs after 48h, as measured by SRM analysis (n=3). (E) SRM analysis of metabolite abundances in mESCs during 6h of Thr restriction, relative to time zero (n=3). (F) SRM analysis of several metabolic ratios over a 6h time course, relative to time zero (n=3). (G) Feeder-free mESCs were subjected to Thr restriction for 12h, then supplemented for 36h with the indicated metabolites at the given concentrations. Alkaline phosphatase-positive colonies were quantified and normalized to mESC colony numbers in normal mESC media (% colonies recovered). X denotes relative concentration with respect to DMEM medium. NAC, N-acetyl-cysteine. Py, pyruvate. DMG, dimethylglycine. Bet, betaine. H, hypoxanthine. T, thymidine. All error bars represent the s.e.m. from three independent measurements.
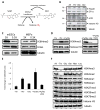
Fig. 3. Influence of Thr-SAM metabolism on H3K4 methylation
(A) Schematic of methyltransferase reactions. (B) Immunoblot analysis of proteins from mESCs with an antibody against methyl-lysine, after restriction indicated amino acids for 24h. (C) Immunoblot analysis of mESCs and MEFs for H3K4me3 and H3ac, when exposed to 3X and 0.3X concentrations for 48h. (D) Immunoblot analysis of mESCs for H3K4me3 after Thr restriction (0X) for 6h, then re-fed for 6h with indicated metabolites. DZA, 3-deaza-adenosine. (E) SAM/SAH ratio after Thr restriction (0X) for 6h, then re-fed for 6h with indicated metabolites. (F) Immunoblot analysis of mESCs for H3K4me3/2/1, K9me3, K27me3, K36me3, and K79me3, after restriction (0X) of indicated amino acids for 24h.
Fig. 4. Threonine dehydrogenase regulates the pluripotency of mESCs
(A) Immunoblot for Tdh, H3K4me3, H3K27me3, and pan-methyl-lysine in mESCs grown under 0.1X Thr, immediately after depletion of Tdh with 2 different shRNAs (shTdh), compared to a control shRNA targeting luciferase (shLuc). (B) Micrographs of alkaline-phosphatase-staining in mESCs after shTdh or shLuc, seeded at clonal density without feeder MEFs and after 48h of culture in 0.1X, 0.3X, and 1X Thr concentrations. (C) Steady-state fraction of intracellular metabolites derived from [U-13C]Thr in mESCs after 24h, as measured by SRM analysis, after 48h dox-induction of shTdh or shLuc (n=3). (D) SRM analysis of metabolite abundances in mESCs after 48h dox-induction of shTdh or shLuc (n=3). All error bars represent the s.e.m. from three independent measurements.
Comment in
- Physiology. When metabolism and epigenetics converge.
Sassone-Corsi P. Sassone-Corsi P. Science. 2013 Jan 11;339(6116):148-50. doi: 10.1126/science.1233423. Science. 2013. PMID: 23307727 No abstract available.
Similar articles
- Physiology. When metabolism and epigenetics converge.
Sassone-Corsi P. Sassone-Corsi P. Science. 2013 Jan 11;339(6116):148-50. doi: 10.1126/science.1233423. Science. 2013. PMID: 23307727 No abstract available. - A regulatory circuitry locking pluripotent stemness to embryonic stem cell: Interaction between threonine catabolism and histone methylation.
Chen G, Wang J. Chen G, et al. Semin Cancer Biol. 2019 Aug;57:72-78. doi: 10.1016/j.semcancer.2019.01.005. Epub 2019 Jan 30. Semin Cancer Biol. 2019. PMID: 30710616 Review. - Proteomic and genomic approaches reveal critical functions of H3K9 methylation and heterochromatin protein-1γ in reprogramming to pluripotency.
Sridharan R, Gonzales-Cope M, Chronis C, Bonora G, McKee R, Huang C, Patel S, Lopez D, Mishra N, Pellegrini M, Carey M, Garcia BA, Plath K. Sridharan R, et al. Nat Cell Biol. 2013 Jul;15(7):872-82. doi: 10.1038/ncb2768. Epub 2013 Jun 9. Nat Cell Biol. 2013. PMID: 23748610 Free PMC article. - Glycine cleavage system determines the fate of pluripotent stem cells via the regulation of senescence and epigenetic modifications.
Tian S, Feng J, Cao Y, Shen S, Cai Y, Yang D, Yan R, Wang L, Zhang H, Zhong X, Gao P. Tian S, et al. Life Sci Alliance. 2019 Sep 27;2(5):e201900413. doi: 10.26508/lsa.201900413. Print 2019 Oct. Life Sci Alliance. 2019. PMID: 31562192 Free PMC article. - Sink into the Epigenome: Histones as Repositories That Influence Cellular Metabolism.
Ye C, Tu BP. Ye C, et al. Trends Endocrinol Metab. 2018 Sep;29(9):626-637. doi: 10.1016/j.tem.2018.06.002. Epub 2018 Jul 11. Trends Endocrinol Metab. 2018. PMID: 30001904 Free PMC article. Review.
Cited by
- Metabolic landscape of the healthy pancreas and pancreatic tumor microenvironment.
Bonilla ME, Radyk MD, Perricone MD, Elhossiny AM, Harold AC, Medina-Cabrera PI, Kadiyala P, Shi J, Frankel TL, Carpenter ES, Green MD, Mitrea C, Lyssiotis CA, Pasca di Magliano M. Bonilla ME, et al. JCI Insight. 2024 Aug 13;9(18):e180114. doi: 10.1172/jci.insight.180114. JCI Insight. 2024. PMID: 39315547 Free PMC article. - Upregulation of E-cadherin by the combination of methionine restriction and HDAC2 intervention for inhibiting gastric carcinoma metastasis.
Li Y, Liu C, Xin L, Liu C, Cao J, Yue Z, Sheng J, Yuan Y, Zhou Q, Liu Z. Li Y, et al. Acta Biochim Biophys Sin (Shanghai). 2024 Jan 25;56(1):62-70. doi: 10.3724/abbs.2023244. Acta Biochim Biophys Sin (Shanghai). 2024. PMID: 38143381 Free PMC article. - Yeast Phenomics: An Experimental Approach for Modeling Gene Interaction Networks that Buffer Disease.
Hartman JL 4th, Stisher C, Outlaw DA, Guo J, Shah NA, Tian D, Santos SM, Rodgers JW, White RA. Hartman JL 4th, et al. Genes (Basel). 2015 Feb 6;6(1):24-45. doi: 10.3390/genes6010024. Genes (Basel). 2015. PMID: 25668739 Free PMC article. - One-Carbon Metabolism in Prostate Cancer: The Role of Androgen Signaling.
Corbin JM, Ruiz-Echevarría MJ. Corbin JM, et al. Int J Mol Sci. 2016 Jul 27;17(8):1208. doi: 10.3390/ijms17081208. Int J Mol Sci. 2016. PMID: 27472325 Free PMC article. Review. - Amino acid metabolism in tumor biology and therapy.
Chen J, Cui L, Lu S, Xu S. Chen J, et al. Cell Death Dis. 2024 Jan 13;15(1):42. doi: 10.1038/s41419-024-06435-w. Cell Death Dis. 2024. PMID: 38218942 Free PMC article. Review.
References
Publication types
MeSH terms
Substances
Grants and funding
- K08 CA157727/CA/NCI NIH HHS/United States
- R00 CA168997/CA/NCI NIH HHS/United States
- R01 GM56203/GM/NIGMS NIH HHS/United States
- HHMI_/Howard Hughes Medical Institute/United States
- R01 GM056203/GM/NIGMS NIH HHS/United States
- U01 HL100001/HL/NHLBI NIH HHS/United States
- RC2 HL102815/HL/NHLBI NIH HHS/United States
- 4R00CA168997-02/CA/NCI NIH HHS/United States
- RC2HL102815/HL/NHLBI NIH HHS/United States
LinkOut - more resources
Full Text Sources
Other Literature Sources


