Mitochondrial dynamics regulates migration and invasion of breast cancer cells - PubMed (original) (raw)
Mitochondrial dynamics regulates migration and invasion of breast cancer cells
J Zhao et al. Oncogene. 2013 Oct.
Abstract
Mitochondria are highly dynamic and undergo constant fusion and fission that are essential for maintaining physiological functions of cells. Although dysfunction of mitochondria has been implicated in tumorigenesis, little is known about the roles of mitochondrial dynamics in metastasis, the major cause of cancer death. In the present study, we found a marked upregulation of mitochondrial fission protein dynamin-related protein 1 (Drp1) expression in human invasive breast carcinoma and metastases to lymph nodes. Compared with non-metastatic breast cancer cells, mitochondria also were more fragmented in metastatic breast cancer cells that express higher levels of total and active Drp1 and less mitochondrial fusion protein 1 (Mfn1). Silencing Drp1 or overexpression of Mfn1 resulted in mitochondria elongation or clusters, respectively, and significantly suppressed metastatic abilities of breast cancer cells. In contrast, silencing Mfn proteins led to mitochondrial fragmentation and enhanced metastatic abilities of breast cancer cells. Interestingly, these manipulations of mitochondrial dynamics altered the subcellular distribution of mitochondria in breast cancer cells. For example, silencing Drp1 or overexpression of Mfn1 inhibited lamellipodia formation, a key step for cancer metastasis, and suppressed chemoattractant-induced recruitment of mitochondria to lamellipodial regions. Conversely, silencing Mfn proteins resulted in more cell spreading and lamellipodia formation, causing accumulation of more mitochondria in lamellipodia regions. More importantly, treatment with a mitochondrial uncoupling agent or adenosine triphosphate synthesis inhibitor reduced lamellipodia formation and decreased breast cancer cell migration and invasion, suggesting a functional importance of mitochondria in breast cancer metastasis. Together, our findings show a new role and mechanism for regulation of cancer cell migration and invasion by mitochondrial dynamics. Thus targeting dysregulated Drp1-dependent mitochondrial fission may provide a novel strategy for suppressing breast cancer metastasis.
Conflict of interest statement
Conflict of interest
The authors declare no conflict of interest.
Figures
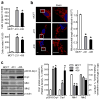
Figure 1. Upregulation of Drp1 protein expression in human breast carcinomas and metastases to lymph node
Representative immunostaining of Drp1 protein in human breast cancer tissue microarrays using a mouse anti-Drp1 antibody as described under “Materials and Methods”.
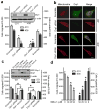
Figure 2. Mitochondria are more fragmented in metastatic breast cancer cells
(a) Comparison of migration and invasion abilities of breast cancer MCF7, MDA-MB-231 and MDA-MB-436 cells. n=5, mean ± s.e.m., *_p<_0.01. (b) Representative images of MCF7, MDA-MB-231 and MDA-MB-436 cells, stained with MitoTracker Red, show mitochondrial morphology (left panel), analyzed by measuring mitochondrial length (right panel). Scale bars, 5 μm. (c) Western blot analysis of Drp1, pS616-Drp1, Mfn1 and Mfn2 expression levels in MCF7, MDA-MB-231 and MDA-MB-436 cells using anti-Drp1, -pS616-Drp1, -Mfn1 and -Mfn2 antibodies (left panel), analyzed by measuring band density (right panel). β-Actin was used as an internal control. n=3, mean ± s.e.m., *_p<_0.01 as compared to that of MCF7 cells.
Figure 3. Reduction of mitochondrial fission suppresses migration and invasion abilities of breast cancer cells
(a) Knockdown of endogenous Drp1 inhibits migration and invasion abilities of breast cancer MDA-MB-231 and MDA-MB-436 cells. n=4, mean ± s.e.m., *_p<_0.01. Inset: Western blot analysis of Drp1 expression in cells transfected with scramble or Drp1 siRNAs. (b) Representative confocal images of MDA-MB-231 cells (upper) and MDA-MB-436 cells (lower), transfected with scramble or Drp1 siRNAs and stained with Mito Tracker Red, show endogenous expression of Drp1 and mitochondrial morphology. Scale bar, 10 μm. Mitochondria are in red, Drp1 is in green, and the nucleus is in dark blue. (c) A GFP-tagged Drp1 mutant, insensitive to Drp1 siRNAs, was expressed in Drp1-silenced breast cancer cells for 48h and cells were then collected for Western blot analysis of Drp1 expression (Inset) and Transwell migration and invasion assays. n=3, mean ± s.e.m., *_p<_0.01. (d) A selective inhibitor of Drp1, Mdivi-1, inhibits migration of breast cancer cells. MDA-MB-231 and MDA-MB-436 cells, pretreated with different concentrations of Mdivi-1 (Sigma) for 30 min, were subjected to Transwell migration assays in response to NIH-3T3 CM. n=3, mean ± s.e.m., *_p<_0.01.
Figure 4. Increased mitochondrial fusion inhibits migration and invasion of breast cancer cells
MDA-MB-231 and MDA-MB-436 cells, transfected with GFP, GFP-tagged Mfn1 or Mfn2 for 24h, were collected for Western blot analysis of Mfn1 and Mfn2 (a), or subjected to migration and invasion assays (b) n=3, mean ± s.e.m., *_p<_0.05. (c) Representative confocal images of MDA-MB-231 and MDA-MB-436 cells, expressing GFP or GFP-tagged Mfn1, stained with MitoTracker Red, show mitochondrial morphology. Mitochondria are in red, GFP is in green, and the nucleus is in dark blue. Scale bar, 10 μm.
Figure 5. Suppression of mitochondrial fusion increases migration and invasion of breast cancer cells
MDA-MB-231 and MDA-MB-436 cells were transfected with scramble or Mfn1 and Mfn2 siRNAs. Mfn1 and Mfn2-silenced cells were then transfected with GFP-tagged, siRNA-insensitive Mfn2 mutant for 24h. Cells were collected for Western blot analysis of Mfn1 and Mfn2 (a), and Tanswell migration and invasion assays (b). n=3, mean ± s.e.m., *_p<_0.05. (c) Representative confocal images of MDA-MB-231 cells, transfected with scramble, Mfn1 and Mfn2 siRNAs without (Mfn1 & 2 siRNAs) or with GFP-tagged, siRNA-insensitive Mfn2 mutant (Mfn2 rescue), stained with MitoTracker Red, show mitochondrial morphology. Mitochondria are in red, and the nucleus is in dark blue. Scale bar, 10 μm.
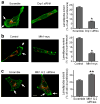
Figure 6. Mitochondrial dynamics regulates lamellipodia formation in breast cancer cells
Decrease in mitochondrial fission (a) or increase in mitochondrial fusion (b) inhibits lamellipodia formation, whereas a decrease in mitochondrial fusion (c) promotes lamellipodia formation, in MDA-MB-231 cells. (a) Cells transfected with scramble or Drp1 siRNAs were seeded on coverslips for 24h. (b) Cells on coverslips were transfected with control vector or vector encoding myc-tagged Mfn1 for 24h. (c) Cells transfected with scramble or Mfn1 and Mfn2 siRNAs were seeded on coverslips for 24h. Cells were stained with Alexa-Fluor 488-labeled phalloidin dyes for F-action (green) and MitoTracker Red for mitochondria (Red), and then visualized by Z-Stack imaging with a confocal microscope. Scale bar, 10 μm. Arrows indicate lamellipodia at cell edges. Lamellipodia extent at cell edges was quantified as a percentage of the cell circumference on 50 randomly selected cells in each group. Columns, means; bar, s.e.m. (n = 4). *p<0.01 and **p<0.05 compared with the scramble or control group.
Figure 7. Mitochondrial fission promotes mitochondrial distribution to lamellipodia
MDA-MB-231 cells stained with MitoTracker Red and CellTracker Green were visualized with a confocal microscope and the integrated fluorescent intensity was analyzed by Image-Pro Plus software. We defined the lamellipodia region as the area from the leading edge of a cell to half of the distance to the nucleus, indicated by the dish line. Scale bar, 10 μm. Relative MitoTracker and CellTracker fluorescence intensities in the lamellipodia region were first normalized to that of the whole cell. The relative abundance of mitochondria in the lamellipodia region was calculated using the ratio of normalized MitoTracker fluorescence intensity vs. normalized CellTracker fluorescence intensity in the lamellipodial region of 50 randomly selected cells in each group. Columns, means; bar, s.e.m. (n = 4). *p<0.01 and **p<0.05 compared with the DMEM, scramble or control group. (a) Chemoattractant NIH-3T3 CM induced distribution of mitochondria to the lamellipodial region in MDA-MB-231 cells. Silencing Drp1 (b) or Mfn1 overexpression (c) blocked mitochondria distribution to lamellipodia in MDA-MB-231 cells. (d) Silencing Mfn1 and Mfn2 directs more mitochondria to lamellipodia in MDA-MB-231 cells.
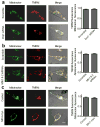
Figure 8. Manipulations of Drp1 and Mfn proteins had no significant effects on the membrane potential of mitochondria in MDA-MB-231 cells
MDA-MB-231 cells stained with TMRM and MitoTracker Green were visualized with a confocal microscope and the integrated fluorescent intensity was analyzed by Image-Pro Plus software. Scale bar, 10 μm. A ratio of TMRM fluorescence and MitoTracker fluorescence was used as an index of mitochondrial membrane potential. Columns, means; bar, s.e.m. of 50 randomly selected cells in each group. (a) Silencing Drp1; (b) silencing Mfn1 and Mfn2; (c) Mfn1 overexpression.
Figure 9. Functional importance of mitochondria in lamellipodia formation and breast cancer cell migration and invasion
MDA-MB-231 cells were incubated with serum-free DMEM or NIH-3T3 CM in the absence or presence of CCCP (100 μM) or oligomycin A (1 μg/ml) for 30 min. (a) Representative confocal images of cells stained with Alexa-Fluor 488-labeled phalloidin dyes for F-action (green) and MitoTracker Red for mitochondria (Red). Scale bar, 10 μm. Arrow points to the lamellipodia. (b) The content of F-actin in cells stained with Alexa-Fluor 488-labeled phalloidin dyes was quantified as described in Materials and Methods. n=3, mean ± s.e.m., *p<0.01 and **_p<_0.05. (c) MDA-MB-231 cells pretreated without (Control) or with CCCP or oligomycin A were subjected to Transwell migration and invasion assays. n=3, mean ± s.e.m., *p<0.01.
Similar articles
- Dynamin-related protein 1-mediated mitochondrial fission contributes to IR-783-induced apoptosis in human breast cancer cells.
Tang Q, Liu W, Zhang Q, Huang J, Hu C, Liu Y, Wang Q, Zhou M, Lai W, Sheng F, Li G, Zhang R. Tang Q, et al. J Cell Mol Med. 2018 Sep;22(9):4474-4485. doi: 10.1111/jcmm.13749. Epub 2018 Jul 11. J Cell Mol Med. 2018. PMID: 29993201 Free PMC article. - Dynamin-related protein 1 and mitochondrial fragmentation in neurodegenerative diseases.
Reddy PH, Reddy TP, Manczak M, Calkins MJ, Shirendeb U, Mao P. Reddy PH, et al. Brain Res Rev. 2011 Jun 24;67(1-2):103-18. doi: 10.1016/j.brainresrev.2010.11.004. Epub 2010 Dec 8. Brain Res Rev. 2011. PMID: 21145355 Free PMC article. Review. - The cyclophilin D/Drp1 axis regulates mitochondrial fission contributing to oxidative stress-induced mitochondrial dysfunctions in SH-SY5Y cells.
Xiao A, Gan X, Chen R, Ren Y, Yu H, You C. Xiao A, et al. Biochem Biophys Res Commun. 2017 Jan 29;483(1):765-771. doi: 10.1016/j.bbrc.2016.12.068. Epub 2016 Dec 18. Biochem Biophys Res Commun. 2017. PMID: 27993675 - New insights into the function and regulation of mitochondrial fission.
Otera H, Ishihara N, Mihara K. Otera H, et al. Biochim Biophys Acta. 2013 May;1833(5):1256-68. doi: 10.1016/j.bbamcr.2013.02.002. Epub 2013 Feb 20. Biochim Biophys Acta. 2013. PMID: 23434681 Review. - Guanylate-binding protein 2 regulates Drp1-mediated mitochondrial fission to suppress breast cancer cell invasion.
Zhang J, Zhang Y, Wu W, Wang F, Liu X, Shui G, Nie C. Zhang J, et al. Cell Death Dis. 2017 Oct 26;8(10):e3151. doi: 10.1038/cddis.2017.559. Cell Death Dis. 2017. PMID: 29072687 Free PMC article.
Cited by
- Research progress on the pharmacological effects of berberine targeting mitochondria.
Fang X, Wu H, Wei J, Miao R, Zhang Y, Tian J. Fang X, et al. Front Endocrinol (Lausanne). 2022 Aug 11;13:982145. doi: 10.3389/fendo.2022.982145. eCollection 2022. Front Endocrinol (Lausanne). 2022. PMID: 36034426 Free PMC article. Review. - Mitochondria in cancer.
Grasso D, Zampieri LX, Capelôa T, Van de Velde JA, Sonveaux P. Grasso D, et al. Cell Stress. 2020 May 11;4(6):114-146. doi: 10.15698/cst2020.06.221. Cell Stress. 2020. PMID: 32548570 Free PMC article. Review. - Mitochondria: a new intervention target for tumor invasion and metastasis.
Zhou Q, Cao T, Li F, Zhang M, Li X, Zhao H, Zhou Y. Zhou Q, et al. Mol Med. 2024 Aug 23;30(1):129. doi: 10.1186/s10020-024-00899-4. Mol Med. 2024. PMID: 39179991 Free PMC article. Review. - DRP1: At the Crossroads of Dysregulated Mitochondrial Dynamics and Altered Cell Signaling in Cancer Cells.
Adhikary A, Mukherjee A, Banerjee R, Nagotu S. Adhikary A, et al. ACS Omega. 2023 Nov 17;8(48):45208-45223. doi: 10.1021/acsomega.3c06547. eCollection 2023 Dec 5. ACS Omega. 2023. PMID: 38075775 Free PMC article. Review. - Changing perspective on oncometabolites: from metabolic signature of cancer to tumorigenic and immunosuppressive agents.
Corrado M, Scorrano L, Campello S. Corrado M, et al. Oncotarget. 2016 Jul 19;7(29):46692-46706. doi: 10.18632/oncotarget.8727. Oncotarget. 2016. PMID: 27083002 Free PMC article. Review.
References
- Jemal A, Bray F, Center MM, Ferlay J, Ward E, Forman D. Global cancer statistics. CA Cancer J Clin. 2011;61:69–90. - PubMed
- Condeelis J, Singer RH, Segall JE. The great escape: when cancer cells hijack the genes for chemotaxis and motility. Annu Rev Cell Dev Biol. 2005;21:695–718. - PubMed
- von Jagow G, Engel WD. Structure and function of the energy-converting system of mitochondria. Angew Chem Int Ed Engl. 1980;19:659–675. - PubMed
Publication types
MeSH terms
Substances
LinkOut - more resources
Full Text Sources
Other Literature Sources
Medical
Research Materials
Miscellaneous


