Incorporating 16S gene copy number information improves estimates of microbial diversity and abundance - PubMed (original) (raw)
Incorporating 16S gene copy number information improves estimates of microbial diversity and abundance
Steven W Kembel et al. PLoS Comput Biol. 2012.
Abstract
The abundance of different SSU rRNA ("16S") gene sequences in environmental samples is widely used in studies of microbial ecology as a measure of microbial community structure and diversity. However, the genomic copy number of the 16S gene varies greatly - from one in many species to up to 15 in some bacteria and to hundreds in some microbial eukaryotes. As a result of this variation the relative abundance of 16S genes in environmental samples can be attributed both to variation in the relative abundance of different organisms, and to variation in genomic 16S copy number among those organisms. Despite this fact, many studies assume that the abundance of 16S gene sequences is a surrogate measure of the relative abundance of the organisms containing those sequences. Here we present a method that uses data on sequences and genomic copy number of 16S genes along with phylogenetic placement and ancestral state estimation to estimate organismal abundances from environmental DNA sequence data. We use theory and simulations to demonstrate that 16S genomic copy number can be accurately estimated from the short reads typically obtained from high-throughput environmental sequencing of the 16S gene, and that organismal abundances in microbial communities are more strongly correlated with estimated abundances obtained from our method than with gene abundances. We re-analyze several published empirical data sets and demonstrate that the use of gene abundance versus estimated organismal abundance can lead to different inferences about community diversity and structure and the identity of the dominant taxa in microbial communities. Our approach will allow microbial ecologists to make more accurate inferences about microbial diversity and abundance based on 16S sequence data.
Conflict of interest statement
The authors have declared that no competing interests exist.
Figures
Figure 1. Conceptual diagram illustrating how variation in genomic 16S copy number could influence observed abundance of 16S gene sequences in a community.
Observed 16S gene sequence abundances (G) in an environmental sequencing data set (A) could be generated by a variety of underlying organismal abundance distributions (N; e.g. B or C) depending on the genomic copy number of the 16S gene (C) within individual cells of the organisms in the community (gray rectangles denote single cells, black symbols denote copies of the 16S gene from different organisms).
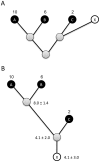
Figure 2. Conceptual diagram showing how copy number can be estimated for environmental sequences using a reference phylogeny.
Given a reference phylogeny with copy number known for species A, B, and C, trait values for a hypothetical novel taxon or sequence X (A) can be estimated in a phylogenetically independent contrasts framework by rerooting the phylogeny at the ancestor of X and its closest relative in the reference phylogeny (B). After rerooting, a predicted trait value and standard error for X can be calculated using ancestral state reconstruction.
Figure 3. Taxa-abundance and taxa-gene curves (number of species in log2-abundance octaves) fit to a simulated distribution of organismal abundances (Ni; black) and resulting gene abundances (Gi; red) for 5000 species.
For each species, abundance P(N) was simulated as a zero-truncated lognormal distribution (mean = 2, variance = 4), copy number P(C) was simulated as a zero-truncated Poisson distribution (mean = 4, variance = 4), and P(G) was calculated as P(G) = P(N)P(C) following Equation 3.
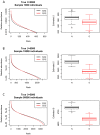
Figure 4. Rank abundance distributions and estimated species pool richness from 100 simulations of communities of (A) 1000, (B) 10000, and (C) 50000 individual genes or organisms sampled from an underlying distribution of abundances (P(N)) and genes (P(G)).
For each simulation, a distribution of organismal abundances (P(N); black) and resulting gene abundances (P(G); red) was generated for 5000 species following the methods described in the caption for Figure 3. Rank-abundance distributions are presented for a single randomly chosen simulation at each sampling intensity. For each simulation, we estimated the number of species S in the species pool using a parametric method , , with the true S = 5000. Estimates of species pool size were significantly higher and closer to the true value based on N versus G at all sampling intensities (ANOVA; P<0.01).
Figure 5. Bacterial reference phylogeny with genomic 16S copy number indicated with black bars (bar length proportional to genomic 16S copy number) and taxonomic order (determined using RDP Taxonomic Classifier [43]) indicated with color shading of branches.
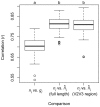
Figure 6. The strength of correlations between true abundance (ni) versus observed gene abundance (gi) or estimated relative abundance () for 100 simulated communities generated by drawing 100 taxa from the 484-taxon reference phylogeny followed by estimation of the phylogenetic placement and copy number for those taxa.
We simulated phylogenetic placement and copy number estimation using full-length 16S sequences and sequences trimmed to the 351 bp V2V3 hypervariable region to simulate pyrosequencing data. Letter codes at top of panel indicate simulations that differed according to a Tukey HSD test (P<0.05; simulations that share a letter not significantly different).
Figure 7. Rank-abundance distributions for two empirical microbial community data sets from (A) human skin microbiome and (B) ocean bacterial communities.
Solid line indicates the expected relative abundance distribution under a lognormal distribution. Gray points are the observed relative gene abundances (gi) of sequences in each data set, and black points are the estimated relative organismal abundances ( ).
).
Figure 8. Comparison of relative abundance of the 20 most abundant taxonomic classes in (A) human microbiome and (B) ocean data sets based on observed gene abundances (gi) and estimated organismal abundances ().
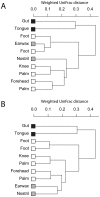
Figure 9. Hierarchical clustering (complete linkage) of communities from the microbiome of a human (subject F1-3 in [13]) based on phylogenetic similarity (weighted UniFrac distance metric) for observed relative gene abundances gi (A) and for estimated organismal relative abundances (B).
Samples are shaded based on human microbiome habitat characteristics (black = gut/mouth, gray = moist skin sites, white = dry skin sites).
References
- Hebert PDN, Cywinska A, Ball SL, DeWaard JR (2003) Biological identifications through DNA barcodes. P Roy Soc B-Biol Sci 270: 313–321 doi:10.1098/rspb.2002.2218 - DOI - PMC - PubMed
- Pace NR (1997) A molecular view of microbial diversity and the biosphere. Science 276: 734–740. - PubMed
- Woese CR, Fox GE (1977) Phylogenetic structure of the prokaryotic domain: The primary kingdoms. Proc Natl Acad Sci U S A 74: 5088–5090 doi:10.1073/pnas.74.11.5088 - DOI - PMC - PubMed
Publication types
MeSH terms
Substances
LinkOut - more resources
Full Text Sources
Research Materials


