Involvement of formyl peptide receptors in receptor for advanced glycation end products (RAGE)--and amyloid beta 1-42-induced signal transduction in glial cells - PubMed (original) (raw)
Involvement of formyl peptide receptors in receptor for advanced glycation end products (RAGE)--and amyloid beta 1-42-induced signal transduction in glial cells
Alexander Slowik et al. Mol Neurodegener. 2012.
Abstract
Background: Recent studies suggest that the chemotactic G-protein-coupled-receptor (GPCR) formyl-peptide-receptor-like-1 (FPRL1) and the receptor-for-advanced-glycation-end-products (RAGE) play an important role in the inflammatory response involved in neurodegenerative disorders such as Alzheimer's disease (AD).Therefore, the expression and co-localisation of mouse formyl peptide receptor (mFPR) 1 and 2 as well as RAGE in an APP/PS1 transgenic mouse model using immunofluorescence and real-time RT-PCR were analysed. The involvement of rat or human FPR1/FPRL1 (corresponds to mFPR1/2) and RAGE in amyloid-β 1-42 (Aβ1-42)-induced signalling were investigated by extracellular signal regulated kinase 1/2 (ERK1/2) phosphorylation. Furthermore, the cAMP level in primary rat glial cells (microglia and astrocytes) and transfected HEK 293 cells was measured. Formyl peptide receptors and RAGE were inhibited by a small synthetic antagonist WRW4 and an inactive receptor variant delta-RAGE, lacking the intracytoplasmatic domains.
Results: We demonstrated a strong increase of mFPR1/2 and RAGE expression in the cortex and hippocampus of APP/PS1 transgenic mice co-localised to the glial cells. In addition, the Aβ1-42-induced signal transduction is dependant on FPRL1, but also on FPR1. For the first time, we have shown a functional interaction between FPRL1/FPR1 and RAGE in RAGE ligands S100B- or AGE-mediated signalling by ERK1/2 phosphorylation and cAMP level measurement. In addition a possible physical interaction between FPRL1 as well as FPR1 and RAGE was shown with co-immunoprecipitation and fluorescence microscopy.
Conclusions: The results suggest that both formyl peptide receptors play an essential role in Aβ1-42-induced signal transduction in glial cells. The interaction with RAGE could explain the broad ligand spectrum of formyl peptide receptors and their important role for inflammation and the host defence against infections.
Figures
Figure 1
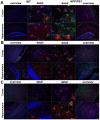
Increased formyl peptide receptors and RAGE expression in astrocytes in a APP/PS1 transgenic mouse model. Coronal brain sections from twelve month old APPswe/PS1dE9 (APP/PS1) or wildtype (WT) mice were stained with anti-glial fibrillary acidic protein (GFAP) to identify astrocytes (red) and anti-mFPR1 (A), anti-mFPR2 (B) or anti-RAGE (C) (green) antibodies (nuclear counterstaining in blue). The figures show representative results for the cortex and hippocampus from one of three independent experiments (Scale bar = 200 μm for overview and 20 μm for detailed images).
Figure 2
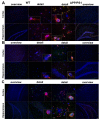
Increased formyl peptide receptors and RAGE expression in microglial cells in a APP/PS1 transgenic mouse model. Coronal brain sections from twelve month old APPswe/PS1dE9 (APP/PS1) or wildtype (WT) mice were stained with anti-ionized calcium binding adaptor molecule-1 (anti-Iba-1) to identify microglial cells (red) and anti-mFPR1 (A), anti-mFPR2 (B) or anti-RAGE (C) (green) antibodies (nuclear counterstaining in blue). The figures show representative results for the cortex and hippocampus from one of three independent experiments (Scale bar = 200 μm for overview and 20 μm for detailed images).
Figure 3
Increased receptor expression in the cortex and hippocampus of twelve month old APP/PS1 transgenic mice. The cortex and hippocampus from twelve month old APP/PS1 or wildtype mice were isolated and mRNA expression of mFPR1 (A), mFPR2 (B) or RAGE (C) were determined using realtime RT-PCR. Data were assessed from six independent experiments in duplicate. An asterisk indicates a significant difference (* = p < 0.05; ** = p < 0.01) compared to wildtype mice as determined by ANOVA followed by Bonferroni test.
Figure 4
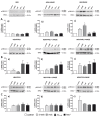
Inhibition of RAGE-mediated G-protein receptor activity by the formyl peptide receptor antagonist WRW4 in glial cells. For analysis of ERK1/2 phosphorylation, astrocytes (A) and microglia (B) were each treated with 1 μM Aβ1–42, 1 μM fMLF, 2.4 μM S100B or 0.75 μM AGE-BSA (AGE) with or without 10 μM WRW4 and with WRW4 alone for 5 min at 37°C. Cells were lysed, equal amounts of protein (5 μg) were dissolved in SDS sample buffer, and the levels of total ERK2 and phosphorylated phosphorylated ERK1/2 were determined via immunoblotting. The positions of phospho-ERK1/2 (pERK1/2) and total ERK2 (ERK2) along with those of the molecular mass markers (in kDa) are indicated on the left side. The values representing mean ± standard error of the mean (SEM) of phosphorylation levels derived from densitometric quantification of three independent experiments are indicated in (C) and (D). An asterisk indicates a significant difference (* - p < 0.05) compared to control as determined by one-way ANOVA and Bonferroni post-hoc test. In order to analyse the inhibition of forskolin-stimulated adenylate cyclase activity, astrocytes (E) and microglia (F) were subjected to either 10 μM (E) or 25 μM (F) forskolin as well as well as to 1 μM Aβ1–42, 1 μM fMLF, 2.4 μM S100B or 0.75 μM AGE-BSA (AGE) with or without 10 lM WRW4 and to WRW4 alone for 15 min at 37°C. cAMP levels were determined as described above (see Methods). The values given represent mean ± SEM from four independent experiments. Asterisks indicate significant differences (*, p < 0.05) between forskolin plus agonists and forskolin alone as determined by one-way ANOVA and Bonferroni post-hoc tests.
Figure 5
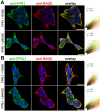
FPR1 and FPRL1 are co-localised with RAGE in primary rat glial cells. Astrocytes and microglial cells were fixed and labelled with anti-FPR1 (A) or anti-FPRL1 (B) and anti-RAGE antibodies. Localisation of FPR1, FPRL1 and RAGE was examined by double fluorescence microscopy. Bisbenzimide was used for nuclear counter-staining (blue). The figures show representative results from one of three independent experiments, each performed in duplicate. Scale bar: 20 μm. The right columns showed resulting scatter plot of intensities across the two channels. The Pearson correlation coefficient rp and Spearman correlation coefficient rs are indicated on the scatter plots. For FPR1 (green channel) and RAGE (red channel) (A), low co-localisation and for FPRL1 (green channel) and RAGE (red channel) (B) good co-localisation.
Figure 6
FPR1 and FPRL1 are co-localised with RAGE in transfected HEK293 cells. FPR1 (A) or FPRL1 (B) and RAGE or ΔRAGE transfected HEK293 cells were fixed and labelled with anti-FPR1 (A) or anti-FPRL1 (B) and anti-RAGE antibodies. Localisation of FPR1, FPRL1 and RAGE/ΔRAGE was examined by double fluorescence microscopy. Bisbenzimide was used for nuclear counter-staining (blue). The figures show representative results from one of three independent experiments, each performed in duplicate. Scale bar: 20 μm. The right columns show the resulting scatter plot of intensities across the two channels. The Pearson correlation coefficient rp and Spearman correlation coefficient rs are indicated on the scatter plots. For FPR1/FPRL1 (green channel) and RAGE/ΔRAGE (red channel), please note a good co-localisation.
Figure 7
RAGE interacts with FPR1 and FPRL1 in glial and transfected HEK293 cells. (A) Membrane proteins from astrocytes or microglia were extracted using anti-ratFPRL1 or ratFPR1 antibodies. (B) Membrane proteins from FPR1 or FPRL1 and RAGE or ΔRAGE transfected HEK293 cells were extracted and anti-humanFPRL1 or humanFPR1 antibodies were used to precipitate. The resulting immunoprecipitates were electrophoretically separated, transferred to nitrocellulose and detected with anti-FPR1, anti-FPRL1 and anti-RAGE antibodies. FPR1 and FPRL1 are co-immunoprecipitate with RAGE in glial as well as transfected HEK293 cells. The positions of molecular mass markers are indicated on the left (in kDa). The values representing mean ± SD of protein and phosphorylation levels derive from densitometric quantification of three independent experiments for co-immunoprecipitated RAGE (C for glial cells and D for transfected HEK293 cells) normalised to FPR1 or FPRL1. An asterisk indicates a significant difference (*p < 0.05) compared to controls on the basis of one-way ANOVA and Bonferroni post-hoc tests. (E) Western Blotting for different receptors of whole cell lysate from astrocytes, microglial and transfected HEK293 cells (each 10 μg protein). The positions of molecular mass markers are indicated on the left (in kDa) and the target on the right.
Figure 8
FPR1-, FPRL1- and RAGE-mediated ERK1/2 phosphorylation in transfected HEK293 cells. For analysis of ERK1/2 phosphorylation, (A) untransfected (a) or ΔRAGE (b), RAGE (c); (B) FPRL1 (a) and ΔRAGE (b) or RAGE (c); (C) FPR1 (a) and ΔRAGE (b) or RAGE (c) expressing HEK293 cells were treated with 1 μM Aβ1–42, 1 μM fMLF, 2.4 μM S100B or 0.75 μM AGE-BSA (AGE) for 5 min at 37°C. Cells were lysed, equal amounts of protein (5 μg) were dissolved by SDS sample buffer, and levels of total ERK2 and phosphorylated ERK1/2 were determined by immunoblotting. The positions of molecular mass markers are indicated on the right (in kDa). The mean ± SD of the three independent experiments were evaluated by densitometric quantification normalised to ERK2 expression. Asterisks indicate a significant difference (*, p < 0.05; **, p < 0,001) compared to control (one-way ANOVA followed by the Bonferroni test).
Figure 9
FPR1-, FPRL1- and RAGE-mediated change of cAMP levels in transfected HEK293 cells. For analysis of inhibition of forskolin-stimulated adenylate cyclase activity, FPRL1 (A) and RAGE (B) or ΔRAGE (C); FPR1 (D) and RAGE (E) or ΔRAGE (F); and RAGE (G) or ΔRAGE (H) expressing HEK293 cells were subjected to 25 μM forskolin as well as 1 μM Aβ1–42, 1 μM fMLF, 2.4 μM S100B or 0.75 μM AGE-BSA (AGE) for 15 min at 37°C. cAMP levels were determined as described above (see Methods). The values represent mean ± SEM from four independent experiments. Asterisks indicate a significant difference (*, p < 0.05; **, p < 0,01) between forskolin plus agonists and forskolin alone, as determined by one-way ANOVA followed by the Bonferroni test.
Figure 10
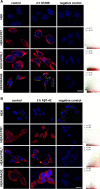
Different receptors and S100B or Aβ1–42 co-localisation in transfected HEK293 cells. Untransfected or FPR1-, FPRL1- or RAGE expressing HEK293 cells were incubated with 2.4 μM S100B or 1 μM Aβ1–42 for 2 h. Cells were fixed and labelled with anti-FPR1, -FPRL1, -RAGE and anti-S100B or anti- Aβ1–42 antibodies. Localisation of FPR1, FPRL1 or RAGE and S100B (A) or Aβ1–42 (B) was examined by double fluorescence microscopy. Bisbenzimide was used for nuclear counter-staining (blue). The figures show representative results from one of three independent experiments, each performed in duplicate. Scale bar: 20 μm. The right columns show the resulting scatter plot of intensities across the two channels. The Pearson correlation coefficient rp and Spearman correlation coefficient rs are indicated on the scatter plots. For FPR1 (red channel) and S100B or Aβ1–42 (green channel), poor or low co-localisation; for FPRL1 (red channel) and S100B or Aβ1–42 (green channel), low or good co-localisation and for RAGE (red channel) and S100B or Aβ1–42 (green channel), both low co-localisation.
Similar articles
- Functional and physical interactions between formyl-peptide-receptors and scavenger receptor MARCO and their involvement in amyloid beta 1-42-induced signal transduction in glial cells.
Brandenburg LO, Konrad M, Wruck CJ, Koch T, Lucius R, Pufe T. Brandenburg LO, et al. J Neurochem. 2010 May;113(3):749-60. doi: 10.1111/j.1471-4159.2010.06637.x. Epub 2010 Feb 5. J Neurochem. 2010. PMID: 20141570 - The formyl peptide receptor like-1 and scavenger receptor MARCO are involved in glial cell activation in bacterial meningitis.
Braun BJ, Slowik A, Leib SL, Lucius R, Varoga D, Wruck CJ, Jansen S, Podschun R, Pufe T, Brandenburg LO. Braun BJ, et al. J Neuroinflammation. 2011 Feb 7;8(1):11. doi: 10.1186/1742-2094-8-11. J Neuroinflammation. 2011. PMID: 21299846 Free PMC article. - Involvement of formyl-peptide-receptor-like-1 and phospholipase D in the internalization and signal transduction of amyloid beta 1-42 in glial cells.
Brandenburg LO, Konrad M, Wruck C, Koch T, Pufe T, Lucius R. Brandenburg LO, et al. Neuroscience. 2008 Oct 2;156(2):266-76. doi: 10.1016/j.neuroscience.2008.07.042. Epub 2008 Aug 5. Neuroscience. 2008. PMID: 18723082 - Binding sites of amyloid beta-peptide in cell plasma membrane and implications for Alzheimer's disease.
Verdier Y, Penke B. Verdier Y, et al. Curr Protein Pept Sci. 2004 Feb;5(1):19-31. doi: 10.2174/1389203043486937. Curr Protein Pept Sci. 2004. PMID: 14965318 Review. - Preventing activation of receptor for advanced glycation endproducts in Alzheimer's disease.
Lue LF, Yan SD, Stern DM, Walker DG. Lue LF, et al. Curr Drug Targets CNS Neurol Disord. 2005 Jun;4(3):249-66. doi: 10.2174/1568007054038210. Curr Drug Targets CNS Neurol Disord. 2005. PMID: 15975028 Review.
Cited by
- The RAGE Axis: A Relevant Inflammatory Hub in Human Diseases.
Rojas A, Lindner C, Schneider I, Gonzalez I, Uribarri J. Rojas A, et al. Biomolecules. 2024 Mar 28;14(4):412. doi: 10.3390/biom14040412. Biomolecules. 2024. PMID: 38672429 Free PMC article. Review. - Role of Formyl Peptide Receptors and β-Arrestin-1 in suPAR Signal Transduction in Mouse Podocytes: Interactions with αVβ3-Integrin.
Kim EY, Dryer SE. Kim EY, et al. Cells. 2024 Jan 17;13(2):172. doi: 10.3390/cells13020172. Cells. 2024. PMID: 38247863 Free PMC article. - Astrocyte-specific knockout of YKL-40/Chi3l1 reduces Aβ burden and restores memory functions in 5xFAD mice.
Zeng X, Cheung SKK, Shi M, Or PMY, Li Z, Liu JYH, Ho WLH, Liu T, Lu K, Rudd JA, Wang Y, Chan AM. Zeng X, et al. J Neuroinflammation. 2023 Dec 2;20(1):290. doi: 10.1186/s12974-023-02970-z. J Neuroinflammation. 2023. PMID: 38042775 Free PMC article. - Stimulation of the Pro-Resolving Receptor Fpr2 Reverses Inflammatory Microglial Activity by Suppressing NFκB Activity.
Wickstead ES, Elliott BT, Pokorny S, Biggs C, Getting SJ, McArthur S. Wickstead ES, et al. Int J Mol Sci. 2023 Nov 6;24(21):15996. doi: 10.3390/ijms242115996. Int J Mol Sci. 2023. PMID: 37958978 Free PMC article. - Microglia in Alzheimer's disease: pathogenesis, mechanisms, and therapeutic potentials.
Miao J, Ma H, Yang Y, Liao Y, Lin C, Zheng J, Yu M, Lan J. Miao J, et al. Front Aging Neurosci. 2023 Jun 15;15:1201982. doi: 10.3389/fnagi.2023.1201982. eCollection 2023. Front Aging Neurosci. 2023. PMID: 37396657 Free PMC article. Review.
References
- Selkoe DJ. Alzheimer's disease results from the cerebral accumulation and cytotoxicity of amyloid beta-protein. J Alzheimers Dis. 2001;3:75–80. - PubMed
Publication types
MeSH terms
Substances
LinkOut - more resources
Full Text Sources
Other Literature Sources
Molecular Biology Databases
Miscellaneous
