Inference of population splits and mixtures from genome-wide allele frequency data - PubMed (original) (raw)
Inference of population splits and mixtures from genome-wide allele frequency data
Joseph K Pickrell et al. PLoS Genet. 2012.
Abstract
Many aspects of the historical relationships between populations in a species are reflected in genetic data. Inferring these relationships from genetic data, however, remains a challenging task. In this paper, we present a statistical model for inferring the patterns of population splits and mixtures in multiple populations. In our model, the sampled populations in a species are related to their common ancestor through a graph of ancestral populations. Using genome-wide allele frequency data and a Gaussian approximation to genetic drift, we infer the structure of this graph. We applied this method to a set of 55 human populations and a set of 82 dog breeds and wild canids. In both species, we show that a simple bifurcating tree does not fully describe the data; in contrast, we infer many migration events. While some of the migration events that we find have been detected previously, many have not. For example, in the human data, we infer that Cambodians trace approximately 16% of their ancestry to a population ancestral to other extant East Asian populations. In the dog data, we infer that both the boxer and basenji trace a considerable fraction of their ancestry (9% and 25%, respectively) to wolves subsequent to domestication and that East Asian toy breeds (the Shih Tzu and the Pekingese) result from admixture between modern toy breeds and "ancient" Asian breeds. Software implementing the model described here, called TreeMix, is available at http://treemix.googlecode.com.
Conflict of interest statement
The authors have declared that no competing interests exist.
Figures
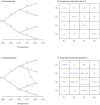
Figure 1. Simple examples.
A. An example tree. B. The covariance matrix implied by the tree structure in A. Note that the covariance here is with respect to the allele frequency at the root, and that each entry has been divided by  to simplify the presentation. C. An example graph. The migration edge is colored red. Parental populations for population 3 are labeled
  and
and  ; see the main text for details. D. The covariance matrix implied by the graph in C; again, each entry has been divided by
  . The migration terms are in red, and the non-migration terms are in blue.
Figure 2. Performance on simulated data.
A. The basic outline of the demographic model used. B. Trees inferred by TreeMix. We simulated 100 independent data sets, under the demographic model in A., and inferred the tree. All simulations gave the same topology; plotted are the mean branch lengths. C. Performance in the presence of migration. We added migration events to the tree in A. and inferred the structure of the graph. Each point represents the error rate over 100 independent simulations, defined as the fraction of simulations where the inferred graph topology does not perfectly match the simulated topology. On the x-axis we show the populations involved in the simulated migration event; e.g., if the source population is 1 and the destination population is 10, this is a migration event from population 1 to population 10, as labeled in A. D. Admixture weight estimation. We simulated admixture events with different weights from population 1 to population 10, and inferred the weight. Each point is the mean across 100 simulations, and the bar represents the range.
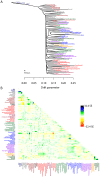
Figure 3. Inferred human tree.
A. Maximum likelihood tree. Plotted is the maximum-likelihood tree. Populations are colored according to geographic location (black: archaic humans, red: Africa, brown: Middle East, green: Europe, blue: Central Asia, purple: America, orange: East Asia). The scale bar shows ten times the average standard error of the entries in the sample covariance matrix ( ). For analysis including Oceania, see Figures S11 and S12. B. Residual fit. Plotted is the residual fit from the maximum likelihood tree in A. We divided the residual covariance between each pair of populations
  and
and  by the average standard error across all pairs. We then plot in each cell
  this scaled residual. Colors are described in the palette on the right. Residuals above zero represent populations that are more closely related to each other in the data than in the best-fit tree, and thus are candidates for admixture events.
Figure 4. Inferred human tree with mixture events.
Plotted is the structure of the graph inferred by TreeMix for human populations, allowing ten migration events. Migration arrows are colored according to their weight. Horizontal branch lengths are proportional to the amount of genetic drift that has occurred on the branch. The scale bar shows ten times the average standard error of the entries in the sample covariance matrix ( ). The residual fit from this graph is shown in Figure S9. Admixture from Neandertals to non-African populations is only apparent when considering subsets of the data (see Discussion and Figure S15).
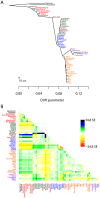
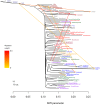
Figure 5. Inferred dog tree.
A. Maximum likelihood tree. Populations are colored according to breed type. Dark blue: wild canids, grey: ancient breeds, brown: spitz breeds, black: toy dogs, red: spaniels, maroon: scent hounds, dark red: working dogs, light green: herding dogs, light blue: mastiff-like dogs, purple: small terriers, orange: retrievers, dark green: sight hounds. The scale bar shows ten times the average standard error of the entries in the sample covariance matrix ( ). B. Residual fit. Plotted is the residual fit from the maximum likelihood tree in A. We divided the residual covariance between each pair of populations
  and
and  by the average standard error across all pairs. We then plot in each cell
  this scaled residual. Colors are described in the palette on the right.
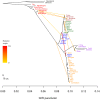
Figure 6. Inferred dog graph.
Plotted is the structure of the graph inferred by TreeMix for dog populations, allowing ten migration events. Migration arrows are colored according to their weight. The scale bar shows ten times the average standard error of the entries in the sample covariance matrix ( ). See the main text for discussion. The residual fit from this graph is presented in Figure S13.
Similar articles
- The genome-wide relationships of the critically endangered Quadricorna sheep in the Mediterranean region.
Senczuk G, Di Civita M, Rillo L, Macciocchi A, Occidente M, Saralli G, D'Onofrio V, Galli T, Persichilli C, Di Giovannantonio C, Pilla F, Matassino D. Senczuk G, et al. PLoS One. 2023 Oct 18;18(10):e0291814. doi: 10.1371/journal.pone.0291814. eCollection 2023. PLoS One. 2023. PMID: 37851594 Free PMC article. - The ancestral origin of the critically endangered Quadricorna sheep as revealed by genome-wide analysis.
Senczuk G, Di Civita M, Rillo L, Macciocchi A, Occidente M, Saralli G, D'Onofrio V, Galli T, Persichilli C, Di Giovannantonio C, Pilla F, Matassino D. Senczuk G, et al. PLoS One. 2022 Oct 26;17(10):e0275989. doi: 10.1371/journal.pone.0275989. eCollection 2022. PLoS One. 2022. PMID: 36288337 Free PMC article. Retracted. - The IGF1 small dog haplotype is derived from Middle Eastern grey wolves.
Gray MM, Sutter NB, Ostrander EA, Wayne RK. Gray MM, et al. BMC Biol. 2010 Feb 24;8:16. doi: 10.1186/1741-7007-8-16. BMC Biol. 2010. PMID: 20181231 Free PMC article. - Evolutionary genomics of dog domestication.
Wayne RK, vonHoldt BM. Wayne RK, et al. Mamm Genome. 2012 Feb;23(1-2):3-18. doi: 10.1007/s00335-011-9386-7. Epub 2012 Jan 22. Mamm Genome. 2012. PMID: 22270221 Review. - Admixture and Ancestry Inference from Ancient and Modern Samples through Measures of Population Genetic Drift.
Harris AM, DeGiorgio M. Harris AM, et al. Hum Biol. 2017 Jan;89(1):21-46. doi: 10.13110/humanbiology.89.1.02. Hum Biol. 2017. PMID: 29285965 Review.
Cited by
- Population genomics reveal deep divergence and strong geographical structure in gentians in the Hengduan Mountains.
Fu PC, Sun SS, Hollingsworth PM, Chen SL, Favre A, Twyford AD. Fu PC, et al. Front Plant Sci. 2022 Aug 25;13:936761. doi: 10.3389/fpls.2022.936761. eCollection 2022. Front Plant Sci. 2022. PMID: 36092450 Free PMC article. - Breeding history and candidate genes responsible for black skin of Xichuan black-bone chicken.
Li D, Sun G, Zhang M, Cao Y, Zhang C, Fu Y, Li F, Li G, Jiang R, Han R, Li Z, Wang Y, Tian Y, Liu X, Li W, Kang X. Li D, et al. BMC Genomics. 2020 Jul 23;21(1):511. doi: 10.1186/s12864-020-06900-8. BMC Genomics. 2020. PMID: 32703156 Free PMC article. - Porous borders at the wild-crop interface promote weed adaptation in Southeast Asia.
Li LF, Pusadee T, Wedger MJ, Li YL, Li MR, Lau YL, Yap SJ, Jamjod S, Rerkasem B, Hao Y, Song BK, Olsen KM. Li LF, et al. Nat Commun. 2024 Feb 21;15(1):1182. doi: 10.1038/s41467-024-45447-0. Nat Commun. 2024. PMID: 38383554 Free PMC article. - Intraspecific polymorphism, interspecific divergence, and the origins of function-altering mutations in deer mouse hemoglobin.
Natarajan C, Hoffmann FG, Lanier HC, Wolf CJ, Cheviron ZA, Spangler ML, Weber RE, Fago A, Storz JF. Natarajan C, et al. Mol Biol Evol. 2015 Apr;32(4):978-97. doi: 10.1093/molbev/msu403. Epub 2015 Jan 2. Mol Biol Evol. 2015. PMID: 25556236 Free PMC article. - Uncovering the genetic history of the present-day Greenlandic population.
Moltke I, Fumagalli M, Korneliussen TS, Crawford JE, Bjerregaard P, Jørgensen ME, Grarup N, Gulløv HC, Linneberg A, Pedersen O, Hansen T, Nielsen R, Albrechtsen A. Moltke I, et al. Am J Hum Genet. 2015 Jan 8;96(1):54-69. doi: 10.1016/j.ajhg.2014.11.012. Epub 2014 Dec 31. Am J Hum Genet. 2015. PMID: 25557782 Free PMC article.
References
- Felsenstein J (1982) How can we infer geography and history from gene frequencies? J Theor Biol 96: 9–20. - PubMed
- Cann RL, Stoneking M, Wilson AC (1987) Mitochondrial DNA and human evolution. Nature 325: 31–6. - PubMed
- Nei M, Roychoudhury AK (1993) Evolutionary relationships of human populations on a global scale. Mol Biol Evol 10: 927–43. - PubMed
Publication types
MeSH terms
Grants and funding
- F32 GM103098/GM/NIGMS NIH HHS/United States
- R01 MH084703/MH/NIMH NIH HHS/United States
- MH084703/MH/NIMH NIH HHS/United States
- HHMI/Howard Hughes Medical Institute/United States
LinkOut - more resources
Full Text Sources
Other Literature Sources
Molecular Biology Databases
