Review: experimental manipulations of microglia in mouse models of Alzheimer's pathology: activation reduces amyloid but hastens tau pathology - PubMed (original) (raw)
Review
Review: experimental manipulations of microglia in mouse models of Alzheimer's pathology: activation reduces amyloid but hastens tau pathology
D C Lee et al. Neuropathol Appl Neurobiol. 2013 Feb.
Abstract
The inflammation hypothesis of Alzheimer's pathogenesis has directed much scientific effort towards ameliorating this disease. The development of mouse models of amyloid deposition permitted direct tests of the proposal that amyloid-activated microglia could cause neurodegeneration in vivo. Many approaches to manipulating microglial activation have been applied to these mouse models, and are the subject of this review. In general, these results do not support a direct neuricidal action of microglia in mouse amyloid models under any activation state. Some of the manipulations cause both a reduction in pathology and a reduction in microglial activation. However, at least for agents like ibuprofen, this outcome may result from a direct action on amyloid production, and a reduction in the microglial-provoking amyloid deposits, rather than from reduced microglial activation leading to a decline in amyloid deposition. Instead, a surprising number of the experimental manipulations which increase microglial activation lead to enhanced clearance of the amyloid deposits. Both the literature and new data presented here suggest that either classical or alternative activation of microglia can lead to enhanced amyloid clearance. However, a limited number of studies comparing the same treatments in amyloid-depositing vs. tau-depositing mice find the opposite effects. Treatments that benefit amyloid pathology accelerate tau pathology. This observation argues strongly that potential treatments be tested for impact on both amyloid and tau pathology before consideration of testing in humans.
© 2012 British Neuropathological Society.
Figures
Figure 1
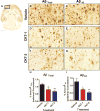
Effects of M1 or M2 cytokine cocktails on amyloid deposition in 22 mo old APP mice. Methods. APP Tg2576 mice on a mixed genetic background from our breeding colony [11] aged 22 mo were injected (unilaterally) with 2 μl of either a) cytokine cocktail [CKT-1: M1 cocktail containing TNF-α (333ng), IL-12 (13ng) and IL-1β (13ng) total mass, with b) CKT-2: M2 cytokine cocktail containing IL-4 (400ng) and IL-13 (120ng total mass), or with c) vehicle control (phosphate-buffered saline). Mice were injected into the right anterior cortex using convection enhanced delivery as described previously [114]. Five days post cytokine injection, mice were intracardially perfused with 25 ml of 0.9% saline. The brain was removed, immersed in 4% paraformaldehyde in 100 mM PO4 buffer (pH 7.4) for 24 hours. The tissue was cryoprotected in a series of 10%, 20% and 30% sucrose solutions. Horizontal sections were cut at 25 μm using a sliding microtome and processed for floating section immunocytochemistry as described previously [115]. Primary antibodies used were rat anti-mouse CD45, rat anti-CD68 (AbD Serotec, Raleigh, NC), rabbit anti-mouse chitinase 3-like-3 (YM1; StemCell Technologies, Vancouver, Canada), rabbit anti-Abeta (Total anti serum, gifted by Paul Gottschall), rabbit anti-Abeta 40, rabbit anti-Abeta 42 (Biosource/Invitrogen, Grand Island, NY). Immunoreaction product in the anterior cortex was quantified as described previously [115]. Sample size was 7–8 per group. Panel A indicates the region quantified by image analysis in the horizontal brain sections. Panels B, D and F show immunostaining using a polyclonal anti-Aß antibody and panels C, E and G show immunostaining for an antibody specific for Aß ending at position 42. Rows specify the treatment used. Panels H and I show the quantification of the Aß staining for total and Aß42 respectively, measured as the ratio of the injected to the uninjected side. Data presented are mean ± sem. * indicate P < 0.05 compared to vehicle treated mice. ** indicates P < 0.01.
Figure 2
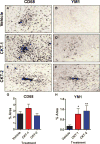
Microglial activation after injection of M1 or M2 cocktails in 22mo old APP mice. Methods as in Fig 1. Panels A, C, and E are stained for CD-68. Panels B, D and F are stained for YM1. Rows specify the treatment conditions. Values are mean ± sem of the immunostained area for each marker in panels G and H.
Similar articles
- Increased tauopathy drives microglia-mediated clearance of beta-amyloid.
Chen W, Abud EA, Yeung ST, Lakatos A, Nassi T, Wang J, Blum D, Buée L, Poon WW, Blurton-Jones M. Chen W, et al. Acta Neuropathol Commun. 2016 Jun 23;4(1):63. doi: 10.1186/s40478-016-0336-1. Acta Neuropathol Commun. 2016. PMID: 27339073 Free PMC article. - Effects of CX3CR1 and Fractalkine Chemokines in Amyloid Beta Clearance and p-Tau Accumulation in Alzheimer's Disease (AD) Rodent Models: Is Fractalkine a Systemic Biomarker for AD?
Merino JJ, Muñetón-Gómez V, Alvárez MI, Toledano-Díaz A. Merino JJ, et al. Curr Alzheimer Res. 2016;13(4):403-12. doi: 10.2174/1567205013666151116125714. Curr Alzheimer Res. 2016. PMID: 26567742 Review. - Anti-Aβ antibodies bound to neuritic plaques enhance microglia activity and mitigate tau pathology.
Laversenne V, Nazeeruddin S, Källstig EC, Colin P, Voize C, Schneider BL. Laversenne V, et al. Acta Neuropathol Commun. 2020 Nov 23;8(1):198. doi: 10.1186/s40478-020-01069-3. Acta Neuropathol Commun. 2020. PMID: 33225991 Free PMC article. - Dystrophic (senescent) rather than activated microglial cells are associated with tau pathology and likely precede neurodegeneration in Alzheimer's disease.
Streit WJ, Braak H, Xue QS, Bechmann I. Streit WJ, et al. Acta Neuropathol. 2009 Oct;118(4):475-85. doi: 10.1007/s00401-009-0556-6. Epub 2009 Jun 10. Acta Neuropathol. 2009. PMID: 19513731 Free PMC article. - Amyloid-β-independent regulators of tau pathology in Alzheimer disease.
van der Kant R, Goldstein LSB, Ossenkoppele R. van der Kant R, et al. Nat Rev Neurosci. 2020 Jan;21(1):21-35. doi: 10.1038/s41583-019-0240-3. Epub 2019 Nov 28. Nat Rev Neurosci. 2020. PMID: 31780819 Review.
Cited by
- Developing therapeutic vaccines against Alzheimer's disease.
Wisniewski T, Drummond E. Wisniewski T, et al. Expert Rev Vaccines. 2016;15(3):401-15. doi: 10.1586/14760584.2016.1121815. Epub 2015 Dec 11. Expert Rev Vaccines. 2016. PMID: 26577574 Free PMC article. Review. - Oxiracetam Offers Neuroprotection by Reducing Amyloid β-Induced Microglial Activation and Inflammation in Alzheimer's Disease.
Zhang H, Jia L, Jia J. Zhang H, et al. Front Neurol. 2020 Jul 17;11:623. doi: 10.3389/fneur.2020.00623. eCollection 2020. Front Neurol. 2020. PMID: 32765394 Free PMC article. - Innate Immunity Stimulation via Toll-Like Receptor 9 Ameliorates Vascular Amyloid Pathology in Tg-SwDI Mice with Associated Cognitive Benefits.
Scholtzova H, Do E, Dhakal S, Sun Y, Liu S, Mehta PD, Wisniewski T. Scholtzova H, et al. J Neurosci. 2017 Jan 25;37(4):936-959. doi: 10.1523/JNEUROSCI.1967-16.2016. J Neurosci. 2017. PMID: 28123027 Free PMC article. - Modulation of inflammation in transgenic models of Alzheimer's disease.
Birch AM, Katsouri L, Sastre M. Birch AM, et al. J Neuroinflammation. 2014 Feb 3;11:25. doi: 10.1186/1742-2094-11-25. J Neuroinflammation. 2014. PMID: 24490742 Free PMC article. Review. - Diversity of transcriptomic microglial phenotypes in aging and Alzheimer's disease.
Boche D, Gordon MN. Boche D, et al. Alzheimers Dement. 2022 Feb;18(2):360-376. doi: 10.1002/alz.12389. Epub 2021 Jul 5. Alzheimers Dement. 2022. PMID: 34223696 Free PMC article. Review.
References
- Akiyama H, Barger S, Barnum S, Bradt B, Bauer J, Cole GM, Cooper NR, Eikelenboom P, Emmerling M, Fiebich BL, Finch CE, Frautschy S, Griffin WS, Hampel H, Hull M, Landreth G, Lue L, Mrak R, Mackenzie IR, McGeer PL, O’Banion MK, Pachter J, Pasinetti G, Plata-Salaman C, Rogers J, Rydel R, Shen Y, Streit W, Strohmeyer R, Tooyoma I, Van Muiswinkel FL, Veerhuis R, Walker D, Webster S, Wegrzyniak B, Wenk G, Wyss-Coray T. Inflammation and Alzheimer’s disease. NeurobiolAging. 2000;21:383–421. - PMC - PubMed
- McGeer PL, Itagaki S, Tago H, McGeer EG. Reactive microglia in patients with senile dementia of the Alzheimer type are positive for the histocompatibility glycoprotein HLA-DR. NeurosciLett. 1987;79:195–200. - PubMed
- Eikelenboom P, Stam FC. Immunoglobulins and complement factors in senile plaques. An immunoperoxidase study. Acta Neuropathol (Berl) 1982;57:239–42. - PubMed
- Rogers J, Luber-Narod J, Styren SD, Civin WH. Expression of immune system-associated antigens by cells of the human central nervous system: relationship to the pathology of Alzheimer’s disease. NeurobiolAging. 1988;9:339–49. - PubMed
- Breitner JC, Welsh KA, Helms MJ, Gaskell PC, Gau BA, Roses AD, Pericak-Vance MA, Saunders AM. Delayed onset of Alzheimer’s disease with nonsteroidal anti-inflammatory and histamine H2 blocking drugs. NeurobiolAging. 1995;16:523–30. - PubMed
Publication types
MeSH terms
Substances
Grants and funding
- AG15490/AG/NIA NIH HHS/United States
- R01 NS076308/NS/NINDS NIH HHS/United States
- AG04418/AG/NIA NIH HHS/United States
- P01 AG004418/AG/NIA NIH HHS/United States
- R01 AG015490/AG/NIA NIH HHS/United States
- NS76308/NS/NINDS NIH HHS/United States
LinkOut - more resources
Full Text Sources
Other Literature Sources
Medical

