A genome-wide RNAi screen reveals a Trio-regulated Rho GTPase circuitry transducing mitogenic signals initiated by G protein-coupled receptors - PubMed (original) (raw)
A genome-wide RNAi screen reveals a Trio-regulated Rho GTPase circuitry transducing mitogenic signals initiated by G protein-coupled receptors
Jose P Vaqué et al. Mol Cell. 2013.
Abstract
Activating mutations in GNAQ and GNA11, encoding members of the Gα(q) family of G protein α subunits, are the driver oncogenes in uveal melanoma, and mutations in Gq-linked G protein-coupled receptors have been identified recently in numerous human malignancies. How Gα(q) and its coupled receptors transduce mitogenic signals is still unclear because of the complexity of signaling events perturbed upon Gq activation. Using a synthetic-biology approach and a genome-wide RNAi screen, we found that a highly conserved guanine nucleotide exchange factor, Trio, is essential for activating Rho- and Rac-regulated signaling pathways acting on JNK and p38, and thereby transducing proliferative signals from Gα(q) to the nucleus independently of phospholipase C-β. Indeed, whereas many biological responses elicited by Gq depend on the transient activation of second-messenger systems, Gq utilizes a hard-wired protein-protein-interaction-based signaling circuitry to achieve the sustained stimulation of proliferative pathways, thereby controlling normal and aberrant cell growth.
Copyright © 2013 Elsevier Inc. All rights reserved.
Figures
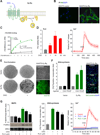
Figure 1. A synthetic biology approach to study the activity of Gαq-coupled receptors activity in mammalian cells
(A) HA-tagged Sy-Rq receptor and its activation by the synthetic ligand CNO. (B) Expression of HA-Sy-Rq in transfected cells (NIH3T3-Sy-Rq) but not in vector transfected controls (NIH3T3-vector). Immunofluorescence anti-HA (green) and DAPI (blue). (C) Binding saturation curves of stable NIH3T3 Sy-Rq cells (Sy-Rq) and vector transfected cells (Control). [3H]-NMS binding to cell membranes was analyzed using a nonlinear curve-fitting program to determine the ligand binding affinity (Kd) maximum ligand binding (Bmax). (D, left) PLC activity (PI-breakdown, fold induction) in NIH3T3-Sy-Rq cells stimulated with CNO (mean ± SEM, N=3). (D, right) Cytosolic [Ca2+] levels after CNO treatment (arrow) (fold increase; mean ± SEM, N=9). (E) NIH3T3-control or Sy-Rq cells seeded on top of NIH3T3 cells, grown with or without CNO. (E, left) wells stained with Giemsa; (E, right) and a Sy-Rq focus (brightfield; top) showing positive anti-HA staining (immunofluorescence; bottom). (F) [3H]- Thymidine incorporation in control vector and Sy-Rq cells treated with CNO or PDGF (fold induction; mean ± SEM, N=3) (left). EdU incorporation (green) and DAPI (blue) in 3T3-Sy-Rq cells stimulated as above (right). (G left) Western-blot and quantification of ERK2 activation in Sy-Rq cells, treated with vehicle (-) or PLCi prior to stimulation with CNO (5 min) (fold increase; mean ± SEM, N=3). (G, center) DNA-synthesis in Sy-Rq cells incubated with PLCi and stimulated with CNO (percentage of the response to CNO in the absence of PLCi; mean ± SEM, N=3). (G, right) Intracellular [Ca2+] levels in Sy-Rq treated with vehicle (red) or PLCi (1 µM, blue; 3 µM green) for 15 minutes prior to CNO stimulation (arrow) (mean ± SEM, N=9). See also Figure S1.
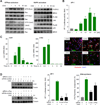
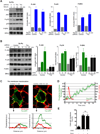
Figure 2. AP-1 is a key downstream target in cell growth promotion by Gq-GPCRs
(A) NIH3T3-Sy-Rq cells treated with CNO were analyzed for RhoA, Rac1, Cdc42 and Ras activation (left) and MAPKs activation (right). (B) AP-1 activation in Sy-Rq cells treated with CNO (fold increase vs control (-) (mean ± SEM, N=3). mRNA analysis of c-jun and c-fos expression in Sy-Rq cells treated with CNO (C, left and center) (fold induction vs untreated cells, 0; mean ± SEM, N=3), and (Right) immunofluorescence showing c-Jun (green) and c-Fos (green) expression, phalloidin (red), and DAPI (blue) (3h CNO treatment). (D) Western-blot analysis of c-Jun and c-Fos in NIH3T3-Sy-Rq cells transfected with siRNAs (control, c-jun or cfos siRNA), and stimulated with CNO (Left). (Center) AP-1 activation (fold increase vs control cells; mean ± SEM, N=3). (Right) DNA synthesis (% of response in siRNA control transfected cells treated with CNO; mean ± SEM, N=3).
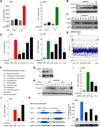
Figure 3. A genome-wide Drosophila RNAi screen identifies novel regulators of AP-1 activation downstream of Gq
(A) (Left) PLC activity (PI-breakdown, dpm of IP1 accumulation) in S2 cells transiently transfected with pIZ (control) or pIZ-M1 (M1) vectors and stimulated with carbachol (mean ± SEM, N=3). (Right) AP-1 activation (fold induction; mean ± SEM, N=3). (B and C) JNK activation in pIZ-M1 transfected cells (B) or in cells transfected with pIZ-M1 and dsRNAs (C) after carbachol stimulation for 5 min (NaCl, 300 nM, 5 min, positive control). (D) PLC and AP1 activity in S2 cells transfected with pIZ-M1 and dsRNAs, stimulated with carbachol (left, fold increase IP1 accumulation and right, AP-1 activity vs unstimulated (-) cells; mean ± SEM, N=3). (E) Scatterplot showing the distribution of hits based on their Z-score. Examples of positive and negative hits are highlighted. (F) Functional characterization of RNAi screen hits with z-scores values <−2.0 or >2.0, expressed as % of total hits. (G) dTrio and dRho protein expression in S2 cells transfected with dsRNA for dTrio or dRho. (H, I, J) dJNK, AP1 and PLC activation in pIZ-M1 cells transfected with dsRNA control (GFP), dTrio and Gαq dsRNA, where indicated, and stimulated with carbachol (mean ± SEM, N=3). (K) (Left) Schematic representation of dTrio DNA expression constructs. The two Rho-GEF domains in Trio-C were mutated as indicated (mGEF1, mGEF2 or mGEF1+2). (Right) AP-1 activation in pIZ-M1 cells transfected with dTrio dsRNAs together with the indicated myc-Trio constructs, and treated with carbachol (% of response to carbachol; control dsRNA considered as 100%; mean ± SEM, N=3). Western blot below shows protein expression of myc-tagged Trio constructs. See also Figure S2.
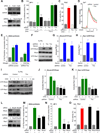
Figure 4. Trio-dependent signaling circuitries elicited by mitogenic Gq activation in mammalian cells
(A) Trio protein expression in NIH3T3-Sy-Rq cells transfected with control (C) or Trio siRNAs (top), and cells stably expressing shRNA-control or Trio sh-RNA (bottom). (B) AP-1 activation in NSy-Rq cells transfected with siRNA control (C) or targeting Trio, and vector control or Trio-C expression vector (Trio-C), expressed as percentage of AP1 response to CNO in siRNA control cells transfected with vector DNA, considered as 100% (mean ± SEM, N=3). (C) PLC activity in cells transfected with siRNA as in B, expressed as the percentage of IP1 accumulation vs siRNA control transfected cells (mean ± SEM, N=3). (D) Intracellular [Ca2+] in cells transfected with control or Trio siRNA stimulated with CNO (fold increase, mean ± SEM of 9 independent measurements). (E) DNA-synthesis in Sy-Rq-shRNA control or – shRNA Trio-A cells stimulated with CNO or serum (fold increase vs unstimulated (-) shRNAcontrol cells; mean ± SEM, N=3). (F). RhoA and Rac1 activation in Sy-Rq shRNA-control or – Trio-A cells stimulated with serum (3 min). (G and H) Quantification of RhoA (G) and Rac1 (H) GTP-bound accumulation (fold increase vs unstimulated control shRNA cells; mean ± SEM, N=3). (I, J, and K) A similar RhoA and Rac1 activation analysis was performed in response to CNO at the indicated times. (L) RhoA and Rac1 expression in Sy-Rq cells transfected with control, or RhoA or Rac1 siRNAs. (M, N, and O) DNA synthesis (M), AP-1 (N) and PLC activity (O) in cells transfected with control, RhoA#1 or Rac#1 siRNAs stimulated with CNO (data are expressed as percentage of response to CNO in control siRNA, considered 100%; mean ± SEM, N=3). See also Figure S3.
Figure 5. Trio activation is required for proliferative signaling through Gq
(A) Activation of ERK, JNK and p38 in NIH3T3-Sy-Rq shRNA-control or -Trio cells stimulated with serum. Representative Western-blots and quantification (graphics; fold increase vs unstimulated control shRNA cells; mean ± SEM, N=3). (B) Activation of ERK, JNK and p38 under the same conditions as in A but stimulated with CNO for the indicated time. (C) Trio recruitment to the plasma membrane. Confocal images of cells transfected with Sy-Rq and Trio-GFP (green) and stained with a plasma membrane maker (red), prior to (0 min) or 10 min after the addition of CNO. Histograms depict fluorescence intensity in arbitrary units (a.u.) along the white line to show the recruitment of Trio to the plasma membrane. No changes in localization were observed when the empty GFP expression vector was used as a control (not shown). (D) Temporal analysis of Trio accumulation at the plasma membrane in cells transfected with Sy-Rq and Trio-GFP after stimulation with CNO (green, left axis) (see Movie S1). Calcium mobilization was measured in parallel (red, right axis). (E) Trio recruitment to the plasma membrane is independent of PLC activity. Percentage of cells per field (40×) showing membrane localization of Trio was quantified in confocal images of cells transfected with Sy-Rq and Trio-GFP before (- ) and after (+) CNO stimulation (10 min) in the absence or presence of 3µM PLCi (See Fig. S4D and Movie S2). Bars, average ± S.E.M of 5 fields of view with 8 to 10 cells each; ns, not statistically significant differences. See also Figure S4.
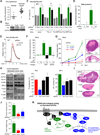
Figure 6. Trio mediates normal and aberrant cell growth elicited by the activation of endogenous Gq-GPCRs and the GNAQ oncogene
(A) Trio mRNA over-expression (ONCOMINE™), in human cervical cancer compared to normal, each data point represents an individual patient tissue sample (data extracted from (Pyeon et al., 2007)). (B) Trio protein expression analysis in human HeLa (cervical) cancer cells stably transfected with the indicated pGIPZ-shRNA expression vectors. (C) HeLa shRNA-control (C) or shRNA-Trio#2 (Trio) cells transfected with pCEFL-HA-Sy-Rq were transfected with vector control (vector), and expression vectors for Trio wild type (wt), and its mutants Trio AE (Trio Q1368A/L1376E, GEF1mut) and Trio L2051E (GEF2mut), and stimulated with CNO. AP-1 reporter activity was determined and expressed as percentage of AP1 response elicited by CNO in Hela-Sy-Rq shControl (mean ± SEM, N=3). (D and E) HeLa shRNA-control or shRNA-Trio#2 cells transfected with pCEFL-HA-Sy-Rq. (D) Effect of CNO on DNA-Synthesis (percentage of increase vs unstimulated control shRNA cells; mean ± SEM, N=3) and (E) cytoplasmic Ca2+ levels (fold increase vs unstimulated control shRNA cells; mean ± SEM, N=3). (F) DNA synthesis in HeLa shRNA-control or shRNA-Trio#2 cells stimulated using GRP or endothelin. Data are expressed as above (mean ± SEM, N=3). (G) Xenografted tumor growth in nude mice injected with HeLa shRNA-control and shRNA-Trio#1 and –Trio#2 cells (mean ± SEM, N=10). Representative H&E-stained tissue section of tumors derived from HeLa shRNA-control and HeLa shRNA-Trio#2 cells. Tumors grow as poorly differentiated squamous cell carcinomas. HeLa cells in which Trio has been knocked down grow much slower. (H) Western-blot analysis of lysates form metastatic human uveal melanoma tumor cells (OMM 1.3) transfected with siRNA targeting Gq or 2 siRNAs targeting Trio, using antibodies against Gq (left panels) and Trio (right panels), tubulin, and total and phosphorylated forms of ERK, p38, and JNK. OMM 1.3 cells were transfected with the indicated siRNA and analyzed for PLC-mediated PI-breakdown and AP-1 activity as indicated. Data are represented as the percentage of the results obtained in cells transfected with the corresponding siRNA control (C) (mean ± SEM, N=3). (I). The picture shows representative H&E sections of metastatic (OMM 1.3) human uveal melanoma shRNA-control and shRNA-Trio#1 and #2 derived tumors. These uveal melanoma cells grow as large tumor xenografts, invading the surrounding muscle (redish stained cell remnants around the tumor mass). Tumor xenografts in which Trio has been knocked down are much smaller, less infiltrative, with large necrotic areas (pinkish area). (J) Average ± S.E.M. of the tumor volume and weight at the end the observation period (n=10 per group). (K) Scheme summarizing the signaling pathways elicited downstream form the activation of Gq-GPCRs. The transient stimulation of PLC and the subsequent increased in ERK activity may represent a general event caused by Gq activation. The duration of signal transmission through PLC-β is limited by its GAP activity of on Gαq. In parallel, Gαq promotes the membrane recruitment of Trio independently on PLC-β activation, thus initiating the prolonged activation of a hardwired mechanism resulting in the sustained activation of Rho and Rac and their downstream targets, thereby promoting the stimulation AP-1 and normal and aberrant cell proliferation. See also Figure S5.
Similar articles
- Hippo-independent activation of YAP by the GNAQ uveal melanoma oncogene through a trio-regulated rho GTPase signaling circuitry.
Feng X, Degese MS, Iglesias-Bartolome R, Vaque JP, Molinolo AA, Rodrigues M, Zaidi MR, Ksander BR, Merlino G, Sodhi A, Chen Q, Gutkind JS. Feng X, et al. Cancer Cell. 2014 Jun 16;25(6):831-45. doi: 10.1016/j.ccr.2014.04.016. Epub 2014 May 29. Cancer Cell. 2014. PMID: 24882515 Free PMC article. - LARG links histamine-H1-receptor-activated Gq to Rho-GTPase-dependent signaling pathways.
Pfreimer M, Vatter P, Langer T, Wieland T, Gierschik P, Moepps B. Pfreimer M, et al. Cell Signal. 2012 Mar;24(3):652-63. doi: 10.1016/j.cellsig.2011.10.014. Epub 2011 Nov 10. Cell Signal. 2012. PMID: 22100544 - Regulation of immediate-early gene transcription following activation of Gα(q)-coupled designer receptors.
Kaufmann A, Keim A, Thiel G. Kaufmann A, et al. J Cell Biochem. 2013 Mar;114(3):681-96. doi: 10.1002/jcb.24410. J Cell Biochem. 2013. PMID: 23059951 - GNAQ and GNA11 mutations in uveal melanoma.
Shoushtari AN, Carvajal RD. Shoushtari AN, et al. Melanoma Res. 2014 Dec;24(6):525-34. doi: 10.1097/CMR.0000000000000121. Melanoma Res. 2014. PMID: 25304237 Review. - The GAPs, GEFs, and GDIs of heterotrimeric G-protein alpha subunits.
Siderovski DP, Willard FS. Siderovski DP, et al. Int J Biol Sci. 2005;1(2):51-66. doi: 10.7150/ijbs.1.51. Epub 2005 Apr 1. Int J Biol Sci. 2005. PMID: 15951850 Free PMC article. Review.
Cited by
- A system for detecting high impact-low frequency mutations in primary tumors and metastases.
Anjanappa M, Hao Y, Simpson ER, Bhat-Nakshatri P, Nelson JB, Tersey SA, Mirmira RG, Cohen-Gadol AA, Saadatzadeh MR, Li L, Fang F, Nephew KP, Miller KD, Liu Y, Nakshatri H. Anjanappa M, et al. Oncogene. 2018 Jan 11;37(2):185-196. doi: 10.1038/onc.2017.322. Epub 2017 Sep 11. Oncogene. 2018. PMID: 28892047 Free PMC article. - Exploring bias in platelet P2Y1 signalling: Host defence versus haemostasis.
Pan D, Ladds G, Rahman KM, Pitchford SC. Pan D, et al. Br J Pharmacol. 2024 Feb;181(4):580-592. doi: 10.1111/bph.16191. Epub 2023 Aug 2. Br J Pharmacol. 2024. PMID: 37442808 Free PMC article. Review. - Co-targeting HGF/cMET Signaling with MEK Inhibitors in Metastatic Uveal Melanoma.
Cheng H, Chua V, Liao C, Purwin TJ, Terai M, Kageyama K, Davies MA, Sato T, Aplin AE. Cheng H, et al. Mol Cancer Ther. 2017 Mar;16(3):516-528. doi: 10.1158/1535-7163.MCT-16-0552. Epub 2017 Jan 30. Mol Cancer Ther. 2017. PMID: 28138035 Free PMC article. - Endothelin-1 Pathway Polymorphisms and Outcomes in Pulmonary Arterial Hypertension.
Benza RL, Gomberg-Maitland M, Demarco T, Frost AE, Torbicki A, Langleben D, Pulido T, Correa-Jaque P, Passineau MJ, Wiener HW, Tamari M, Hirota T, Kubo M, Tiwari HK. Benza RL, et al. Am J Respir Crit Care Med. 2015 Dec 1;192(11):1345-54. doi: 10.1164/rccm.201501-0196OC. Am J Respir Crit Care Med. 2015. PMID: 26252367 Free PMC article. - Uveal melanoma: Recent advances in immunotherapy.
Sorrentino FS, De Rosa F, Di Terlizzi P, Toneatto G, Gabai A, Finocchio L, Salati C, Spadea L, Zeppieri M. Sorrentino FS, et al. World J Clin Oncol. 2024 Jan 24;15(1):23-31. doi: 10.5306/wjco.v15.i1.23. World J Clin Oncol. 2024. PMID: 38292657 Free PMC article. Review.
References
- Baldwin C, Garnis C, Zhang L, Rosin MP, Lam WL. Multiple microalterations detected at high frequency in oral cancer. Cancer Res. 2005;65:7561–7567. - PubMed
- Bellanger JM, Estrach S, Schmidt S, Briancon-Marjollet A, Zugasti O, Fromont S, Debant A. Different regulation of the Trio Dbl-Homology domains by their associated PH domains. Biol Cell. 2003;95:625–634. - PubMed
- Bleasdale JE, Bundy GL, Bunting S, Fitzpatrick FA, Huff RM, Sun FF, Pike JE. Inhibition of phospholipase C dependent processes by U-73, 122. Adv Prostaglandin Thromboxane Leukot Res. 1989;19:590–593. - PubMed
Publication types
MeSH terms
Substances
LinkOut - more resources
Full Text Sources
Other Literature Sources
Molecular Biology Databases
Research Materials
Miscellaneous
