PGDD: a database of gene and genome duplication in plants - PubMed (original) (raw)
. 2013 Jan;41(Database issue):D1152-8.
doi: 10.1093/nar/gks1104. Epub 2012 Nov 24.
Affiliations
- PMID: 23180799
- PMCID: PMC3531184
- DOI: 10.1093/nar/gks1104
PGDD: a database of gene and genome duplication in plants
Tae-Ho Lee et al. Nucleic Acids Res. 2013 Jan.
Abstract
Genome duplication (GD) has permanently shaped the architecture and function of many higher eukaryotic genomes. The angiosperms (flowering plants) are outstanding models in which to elucidate consequences of GD for higher eukaryotes, owing to their propensity for chromosomal duplication or even triplication in a few cases. Duplicated genome structures often require both intra- and inter-genome alignments to unravel their evolutionary history, also providing the means to deduce both obvious and otherwise-cryptic orthology, paralogy and other relationships among genes. The burgeoning sets of angiosperm genome sequences provide the foundation for a host of investigations into the functional and evolutionary consequences of gene and GD. To provide genome alignments from a single resource based on uniform standards that have been validated by empirical studies, we built the Plant Genome Duplication Database (PGDD; freely available at http://chibba.agtec.uga.edu/duplication/), a web service providing synteny information in terms of colinearity between chromosomes. At present, PGDD contains data for 26 plants including bryophytes and chlorophyta, as well as angiosperms with draft genome sequences. In addition to the inclusion of new genomes as they become available, we are preparing new functions to enhance PGDD.
Figures
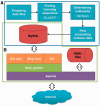
Figure 1.
Diagram of current PGDD server. (A) Diagram of pipeline to update PGDD with new genome data (in blue box). The boxes in the diagram represent four major steps of the pipeline, consisting of 18 in-house scripts. Insets in some boxes contain the name of a major program in the process. (B) Layers diagram of PGDD structure (in green polygon).
Figure 2.
Homepage and examples of three major functions of PGDD. (A) The homepage of PGDD and functions supported by the database. (B) Web page of Dot plot function and a plot applying a Ks filter of 0.4–0.7 between rice and sorghum as an example, representing colinear blocks between the plants. (C) Example of Locus-search result for AT1G25460 loci in Arabidopsis. A blue line in alignment image represents same orientations of paired genes, whereas the red line represents opposite orientations of the genes. (D) Example of Map-view function. The grey vertical bars represent chromosomes, and green arrows on the bars represent the position of locus, which are similar to input sequences. The detailed loci information page, the inset, shows protein and nucleotide sequences of gene in the loci and a description of the gene.
Similar articles
- Plant Genome Duplication Database.
Lee TH, Kim J, Robertson JS, Paterson AH. Lee TH, et al. Methods Mol Biol. 2017;1533:267-277. doi: 10.1007/978-1-4939-6658-5_16. Methods Mol Biol. 2017. PMID: 27987177 - Paleopolyploidy and its impact on the structure and function of modern plant genomes.
Paterson AH. Paterson AH. Genome Dyn. 2008;4:1-12. doi: 10.1159/000125999. Genome Dyn. 2008. PMID: 18756073 - Unravelling angiosperm genome evolution by phylogenetic analysis of chromosomal duplication events.
Bowers JE, Chapman BA, Rong J, Paterson AH. Bowers JE, et al. Nature. 2003 Mar 27;422(6930):433-8. doi: 10.1038/nature01521. Nature. 2003. PMID: 12660784 - Comparing Arabidopsis to other flowering plants.
Barnes S. Barnes S. Curr Opin Plant Biol. 2002 Apr;5(2):128-34. doi: 10.1016/s1369-5266(02)00239-x. Curr Opin Plant Biol. 2002. PMID: 11856608 Review. - Gene duplication as a major force in evolution.
Magadum S, Banerjee U, Murugan P, Gangapur D, Ravikesavan R. Magadum S, et al. J Genet. 2013 Apr;92(1):155-61. doi: 10.1007/s12041-013-0212-8. J Genet. 2013. PMID: 23640422 Review.
Cited by
- Genome-Wide Analysis of Cation/Proton Antiporter Family in Soybean (Glycine max) and Functional Analysis of GmCHX20a on Salt Response.
Jia Q, Song J, Zheng C, Fu J, Qin B, Zhang Y, Liu Z, Jia K, Liang K, Lin W, Fan K. Jia Q, et al. Int J Mol Sci. 2023 Nov 21;24(23):16560. doi: 10.3390/ijms242316560. Int J Mol Sci. 2023. PMID: 38068884 Free PMC article. - Evolution of Gene Duplication in Plants.
Panchy N, Lehti-Shiu M, Shiu SH. Panchy N, et al. Plant Physiol. 2016 Aug;171(4):2294-316. doi: 10.1104/pp.16.00523. Epub 2016 Jun 10. Plant Physiol. 2016. PMID: 27288366 Free PMC article. Review. - Genome-Wide Identification of the PHD-Finger Family Genes and Their Responses to Environmental Stresses in Oryza sativa L.
Sun M, Jia B, Yang J, Cui N, Zhu Y, Sun X. Sun M, et al. Int J Mol Sci. 2017 Sep 19;18(9):2005. doi: 10.3390/ijms18092005. Int J Mol Sci. 2017. PMID: 32961651 Free PMC article. - Genome-Wide Comprehensive Analysis of the SABATH Gene Family in Arabidopsis and Rice.
Wang B, Li M, Yuan Y, Liu S. Wang B, et al. Evol Bioinform Online. 2019 Jul 3;15:1176934319860864. doi: 10.1177/1176934319860864. eCollection 2019. Evol Bioinform Online. 2019. PMID: 31320793 Free PMC article. - Dissecting the Genome-Wide Evolution and Function of R2R3-MYB Transcription Factor Family in Rosa chinensis.
Han Y, Yu J, Zhao T, Cheng T, Wang J, Yang W, Pan H, Zhang Q. Han Y, et al. Genes (Basel). 2019 Oct 18;10(10):823. doi: 10.3390/genes10100823. Genes (Basel). 2019. PMID: 31635348 Free PMC article.
References
- Galitski T, Saldanha AJ, Styles CA, Lander ES, Fink GR. Ploidy regulation of gene expression. Science. 1999;285:251–254. - PubMed
- Hughes T, Roberts C, Dai H, Jones A, Meyer M, Slade D, Burchard J, Dow S, Ward T, Kidd M, et al. Widespread aneuploidy revealed by DNA microarray expression profiling. Nat. Genet. 2000;25:333–337. - PubMed
- Ohno S. Evolution by Gene Duplication. Berlin: Springer; 1970.
- Stephens S. Possible significance of duplications in evolution. Adv. Genet. 1951;4:247–265. - PubMed

