Genome-wide mapping of human DNA-replication origins: levels of transcription at ORC1 sites regulate origin selection and replication timing - PubMed (original) (raw)
Genome-wide mapping of human DNA-replication origins: levels of transcription at ORC1 sites regulate origin selection and replication timing
Gaetano Ivan Dellino et al. Genome Res. 2013 Jan.
Abstract
We report the genome-wide mapping of ORC1 binding sites in mammals, by chromatin immunoprecipitation and parallel sequencing (ChIP-seq). ORC1 binding sites in HeLa cells were validated as active DNA replication origins (ORIs) using Repli-seq, a method that allows identification of ORI-containing regions by parallel sequencing of temporally ordered replicating DNA. ORC1 sites were universally associated with transcription start sites (TSSs) of coding or noncoding RNAs (ncRNAs). Transcription levels at the ORC1 sites directly correlated with replication timing, suggesting the existence of two classes of ORIs: those associated with moderate/high transcription levels (≥1 RNA copy/cell), firing in early S and mapping to the TSSs of coding RNAs; and those associated with low transcription levels (<1 RNA copy/cell), firing throughout the entire S and mapping to TSSs of ncRNAs. These findings are compatible with a scenario whereby TSS expression levels influence the efficiency of ORC1 recruitment at G(1) and the probability of firing during S.
Figures
Figure 1.
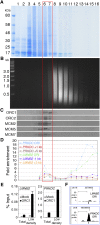
ORI chromatin segregates from bulk chromatin in density gradients. (A,B) Cross-linked chromatin was fractionated by CsCl density-gradient centrifugation into 16 fractions and analyzed by gel electrophoresis. The densities (g/cm3) of fractions 1–16 are 1.23, 1.24, 1.26, 1.28, 1.30, 1.32, 1.34, 1.37, 1.39, 1.42, 1.45, 1.49, 1.52, 1.57, 1.62, and 1.67, respectively. (A) Protein distribution (Coomassie staining of 8% SDS PAGE). (B) DNA distribution (ethidium bromide staining of 1% agarose). (C) Western blot showing the distribution of ORC1 and 2, MCM2, 5, and 7 in the gradient fractions. (D) Q-PCR distribution of DNA fragments from the LMNB2 and PRKDC ORIs and flanking regions (LMNB2: −1, +3 kb; PRKDC: +1, +5 kb), expressed as “fold enrichment” over input DNA of each fraction. (E) Q-ChIP of ORC1 binding at LMNB2 and PRKDC ORIs using anti-ORC1 or anti-Flag (Mock) antibodies from total chromatin or low-density fractions (6, 7). (F) ChIP-seq profile of ORC1 at LMNB2 and PRKDC ORIs. The position of the Q-PCR probes used in E is shown below each ORC1 peak. (Scale bars) 1 kb. Illumina sequencing was performed with purified DNA from anti-ORC1 ChIP of fractions 6 and 7 (red empty box) or with total DNA of fractions 14–16 (shown in Supplemental Figs. S1, S2).
Figure 2.
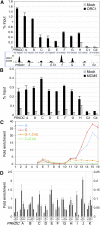
High-resolution validation of newly identified ORIs. Q-ChIP of ORC1 (A) and MCM5 (B) binding to the PRKDC ORI, eight newly identified ORC1 peaks (A–H), and four control regions (C1–C4), using anti-ORC1, anti-MCM5, or anti-Flag (Mock) antibodies and chromatin of low-density fractions. (Error bars) SD; n = 2. The position of Q-PCR probes, relative to the summit of ORC1 peaks, is shown at the bottom of A. (Scale bar) 1 kb. (C) Distribution of DNA fragments from two ORC1 peaks (C, G) and their flanking regions (+5 and −1.5 kb, respectively). (D) NSA assay of the PRKDC ORI, A–K ORC1 sites, and their flanking regions (distance from the probe within the ORC1 peak, in kilobases, is shown below). The amplitude of the I–K peaks is shown in Supplemental Figure S3. The amounts of SNSs are relative to PRKDC ORI (=1).
Figure 3.
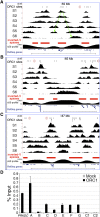
Genomic validation of newly identified ORIs. Visualization of HeLa Repli-seq in the UCSC Genome Browser showing three genomic regions: two (A and B) from chromosome 8 (adjacent regions; same _y_-axis value ranges) and one (C) from chromosome 6, spanning a total of 18.2 Mb. ORC1 peaks (black vertical lines), S1–S6 sequence-tag densities, the algorithmically identified inverted-V apexes (red filled boxes), the s50 profile (see Methods), and RefSeq genes are shown. (A) One representative inverted-V is shown as two green arrows (the right one also corresponds to a temporal transition region). (Open red circles) ORC1 peaks mapping outside inverted-V apexes. (Scale bars) 5 Mb. (D) Q-ChIP of ORC1 binding to the PRKDC ORI, the newly identified ORC1 peaks mapping to TSS of known genes (A–G) and two control regions (C1 and C2, as in Fig. 2A), using anti-ORC1 or anti-Flag (Mock) antibodies and chromatin of low-density fractions from human activated CD4+ T cells (see text). (Error bars) SD; n = 2. The Q-PCR probes are as in Figure 2A.
Figure 4.
Characterization of the ORC1-associated RNAs. ChIP-seq profiles of ORC1, K4me3, and POLR2A at newly identified ORIs, mapping within proximal promoters of known genes (A–D), intergenic (E–J), or intragenic (K–O) regions. Overlap with TSSs identified in the TSS-seq data set or with statistically significant K4me3 or POLR2A peaks is indicated below each panel. _y_-axis value ranges, where not indicated, are 1–12 (ORC1); 1–30 (POLR2A and K4me3). RefSeq genes and RNA-seq tags are as of March 2011. Dashed lines in the RNA-seq track indicate picture clipping. (Scale bar) 5 kb.
Figure 5.
Association of ORC1 sites with RNA-seq tags and functional TSSs. Pie diagram showing numbers and percentages of ORC1 peaks overlapping, or not, with HeLa RNA-seq tags (RNA-seq+ or RNA-Seq−), or with TSSs identified in the TSS-seq data set (TSS-seq+ or TSS-seq−) (Yamashita et al. 2011) or in the RefSeq/UCSC data set (TSS-RefSeq+ or TSS-RefSeq−). TSS-seq+ peaks can be associated, or not, with annotated TSS (TSS-RefSeq±): Among the 7624 RNA-seq+/TSS-RefSeq+, 4377 are TSS-RefSeq+ and 3247 TSS-RefSeq−; among the 1169 RNA-seq−/TSS-seq+, 138 are TSS-RefSeq+ and 1031 TSS-RefSeq−.
Figure 6.
Transcription levels at ORC1 peaks correlate with replication timing. (A) Boxplots of the transcription levels measured at ORC1 peaks replicating in the S1–S6 windows. (B) Frequency of early (S1 + S2), middle (S3 + S4), or late (S5 + S6) replicating ORC1 peaks within groups with homogenous expression (<1, 1–10, or ≥10 RNA copies/cell). (C) Frequency of ORC1 peaks with different transcription levels (<1, 1–10, or ≥10 RNA copies/cell) within groups of ORC1 sites homogeneous for replication timing. (D) Boxplots of the s50 values of ORC1 peaks with different transcription levels (<1, 1–10, or ≥10 RNA copies/cell) mapping within very-early-replicating (S1) inverted-V apexes. (E) Boxplots of the transcription levels measured at the ORC1 peaks mapping within proximal promoters of known genes, intragenic, or intergenic regions, as indicated. (F) Frequency of ORC1 peaks with different transcription levels (<1, 1–10, or ≥10 RNA copies/cell) for each genomic location, as indicated. (G) Frequency of early (S1 + S2), middle (S3 + S4), or late (S5 + S6) replicating ORC1 peaks for each genomic location, as indicated.
Similar articles
- Orc1 Binding to Mitotic Chromosomes Precedes Spatial Patterning during G1 Phase and Assembly of the Origin Recognition Complex in Human Cells.
Kara N, Hossain M, Prasanth SG, Stillman B. Kara N, et al. J Biol Chem. 2015 May 8;290(19):12355-69. doi: 10.1074/jbc.M114.625012. Epub 2015 Mar 17. J Biol Chem. 2015. PMID: 25784553 Free PMC article. - ORC1 binds to cis-transcribed RNAs for efficient activation of replication origins.
Mas AM, Goñi E, Ruiz de Los Mozos I, Arcas A, Statello L, González J, Blázquez L, Lee WTC, Gupta D, Sejas Á, Hoshina S, Armaos A, Tartaglia GG, Waga S, Ule J, Rothenberg E, Gómez M, Huarte M. Mas AM, et al. Nat Commun. 2023 Jul 24;14(1):4447. doi: 10.1038/s41467-023-40105-3. Nat Commun. 2023. PMID: 37488096 Free PMC article. - Genomic study of replication initiation in human chromosomes reveals the influence of transcription regulation and chromatin structure on origin selection.
Karnani N, Taylor CM, Malhotra A, Dutta A. Karnani N, et al. Mol Biol Cell. 2010 Feb 1;21(3):393-404. doi: 10.1091/mbc.e09-08-0707. Epub 2009 Dec 2. Mol Biol Cell. 2010. PMID: 19955211 Free PMC article. - [Regulation of initiation of DNA replication in through G1 to S phases: overview].
Masukata H. Masukata H. Tanpakushitsu Kakusan Koso. 2009 Mar;54(4 Suppl):317-9. Tanpakushitsu Kakusan Koso. 2009. PMID: 21089469 Review. Japanese. No abstract available. - Promoters are key organizers of the duplication of vertebrate genomes.
Brossas C, Duriez B, Valton AL, Prioleau MN. Brossas C, et al. Bioessays. 2021 Oct;43(10):e2100141. doi: 10.1002/bies.202100141. Epub 2021 Jul 28. Bioessays. 2021. PMID: 34319621 Review.
Cited by
- Genome-wide identification of replication fork stalling/pausing sites and the interplay between RNA Pol II transcription and DNA replication progression.
Rojas P, Wang J, Guglielmi G, Sadurnì MM, Pavlou L, Leung GHD, Rajagopal V, Spill F, Saponaro M. Rojas P, et al. Genome Biol. 2024 May 21;25(1):126. doi: 10.1186/s13059-024-03278-8. Genome Biol. 2024. PMID: 38773641 Free PMC article. - Integrative analysis of DNA replication origins and ORC-/MCM-binding sites in human cells reveals a lack of overlap.
Tian M, Wang Z, Su Z, Shibata E, Shibata Y, Dutta A, Zang C. Tian M, et al. Elife. 2024 Apr 3;12:RP89548. doi: 10.7554/eLife.89548. Elife. 2024. PMID: 38567819 Free PMC article. - The Origin Recognition Complex: From Origin Selection to Replication Licensing in Yeast and Humans.
Tye BK, Zhai Y. Tye BK, et al. Biology (Basel). 2023 Dec 25;13(1):13. doi: 10.3390/biology13010013. Biology (Basel). 2023. PMID: 38248444 Free PMC article. Review. - The dimeric deubiquitinase USP28 integrates 53BP1 and MYC functions to limit DNA damage.
Jin C, Einig E, Xu W, Kollampally RB, Schlosser A, Flentje M, Popov N. Jin C, et al. Nucleic Acids Res. 2024 Apr 12;52(6):3011-3030. doi: 10.1093/nar/gkae004. Nucleic Acids Res. 2024. PMID: 38227944 Free PMC article. - DNA replication and replication stress response in the context of nuclear architecture.
González-Acosta D, Lopes M. González-Acosta D, et al. Chromosoma. 2024 Jan;133(1):57-75. doi: 10.1007/s00412-023-00813-7. Epub 2023 Dec 6. Chromosoma. 2024. PMID: 38055079 Free PMC article. Review.
References
- Bell SP, Stillman B 1992. ATP-dependent recognition of eukaryotic origins of DNA replication by a multiprotein complex. Nature 357: 128–134 - PubMed
- Bell O, Tiwari VK, Thoma NH, Schubeler D 2011. Determinants and dynamics of genome accessibility. Nat Rev Genet 12: 554–564 - PubMed
- Cayrou C, Coulombe P, Vigneron A, Stanojcic S, Ganier O, Peiffer I, Rivals E, Puy A, Laurent-Chabalier S, Desprat R, et al. 2011. Genome-scale analysis of metazoan replication origins reveals their organization in specific but flexible sites defined by conserved features. Genome Res 21: 1438–1449 - PMC - PubMed
Publication types
MeSH terms
Substances
LinkOut - more resources
Full Text Sources
Other Literature Sources


