DANPOS: dynamic analysis of nucleosome position and occupancy by sequencing - PubMed (original) (raw)
DANPOS: dynamic analysis of nucleosome position and occupancy by sequencing
Kaifu Chen et al. Genome Res. 2013 Feb.
Abstract
Recent developments in next-generation sequencing have enabled whole-genome profiling of nucleosome organizations. Although several algorithms for inferring nucleosome position from a single experimental condition have been available, it remains a challenge to accurately define dynamic nucleosomes associated with environmental changes. Here, we report a comprehensive bioinformatics pipeline, DANPOS, explicitly designed for dynamic nucleosome analysis at single-nucleotide resolution. Using both simulated and real nucleosome data, we demonstrated that bias correction in preliminary data processing and optimal statistical testing significantly enhances the functional interpretation of dynamic nucleosomes. The single-nucleotide resolution analysis of DANPOS allows us to detect all three categories of nucleosome dynamics, such as position shift, fuzziness change, and occupancy change, using a uniform statistical framework. Pathway analysis indicates that each category is involved in distinct biological functions. We also analyzed the influence of sequencing depth and suggest that even 200-fold coverage is probably not enough to identify all the dynamic nucleosomes. Finally, based on nucleosome data from the human hematopoietic stem cells (HSCs) and mouse embryonic stem cells (ESCs), we demonstrated that DANPOS is also robust in defining functional dynamic nucleosomes, not only in promoters, but also in distal regulatory regions in the mammalian genome.
Figures
Figure 1.
Flowchart of the nucleosome dynamic analysis pipeline in DANPOS. (A) Schematic illustration of nucleosome occupancy calculation. (Purple line) DNA sequence. (Red arrows) Normal reads at both ends of a nucleosome; (gray arrows) clonal reads. (Red areas) Calculated nucleosome occupancy. (B) The alternative data normalization methods. (C) Calculation of differential signals at single nucleotide resolution. (Red and sky-blue areas) Nucleosome occupancies in samples A and B, respectively. (Blue area) Differential signal at single nucleotide resolution between samples A and B. Five statistical tests that can be used to calculate differential signal are listed on the right. (D) Differential nucleosome peaks. (Blue dashed curves) Differential signals at single nucleotide resolution. (Blue bars) Differential nucleosome peaks called based on the differential signals. (E) A cartoon to show the three categories of dynamic nucleosomes. (Red and sky-blue dashed curves) Nucleosome occupancy in samples A and B, respectively. (Red and sky-blue blocks) Baseline nucleosome peaks with differential signals and peaks displayed as in D.
Figure 2.
ROC curves indicate that the default DANPOS algorithm improves the identification of dynamic nucleosomes. Each column assesses the rate of true and false positive dynamic nucleosomes identified by different preliminary data processing methods (left), data normalization methods (middle), or statistical tests (right). Each row presents the results from simulation of nucleosome occupancy changes (top), fuzziness change (middle), and position shift (bottom). The known nucleosome changes were simulated from a nucleosome reference map (see Methods).
Figure 3.
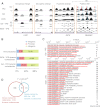
Dynamic nucleosomes identified by DANPOS explain environmental changes. (A) Snapshots of individual dynamic nucleosome regions. Categories of dynamic nucleosomes were labeled on top of each region. Nucleosome occupancies in YPD, Gal, and EtOH conditions were plotted as black areas in the top three tracks, where black bars in each track represent baseline nucleosome peaks. Nucleosome differential signals between YPD and Gal (Gal-YPD) or EtOH (EtOH-YPD) are plotted as black (positive) or gray (negative) areas in the bottom two tracks, and black bars in these tracks represent dynamic nucleosome peaks. (Black arrows) Position and direction of genes. Red and sky-blue dashed lines in the position shift plot indicate the dyads of nucleosomes in the YPD and EtOH conditions, respectively. (B) The percentages of dynamic nucleosomes in intragenic, promoter, and intergenic regions. Promoter is defined as the −350 to +50-bp regions flanking each TSS. Intragenic region is defined as the region from 50 bp downstream from the TSS to the 3′ end of the gene, and all remaining regions are defined as intergenic. (C) Enrichment of biological processes in genes associated with dynamic nucleosomes on promoters. (D) Counts of genes associated with dynamic nucleosomes on promoters.
Figure 4.
DANPOS classifies dynamic nucleosomes as position shifts, fuzziness changes, and occupancy changes. (A) Heatmaps (left and middle) and average profile plot (right) to show nucleosome occupancy in regions containing EtOH-YPD dynamic nucleosomes. Each line in the heatmaps represents a 400-bp region flanking the dyad of a dynamic nucleosome; for position shifts, the heatmap for the EtOH condition is plotted flanking the dyads defined in the YPD condition. Nucleosomes showing EtOH-YPD occupancy increase (top right), fuzziness increase (middle right), or position shift toward the 5′ direction on positive strand (bottom right) were pooled to plot average occupancy at each base pair flanking dyads. (B) Venn diagram for the overlap between different categories of EtOH-YPD dynamic nucleosomes. (C) The percentage of EtOH-YPD dynamic nucleosomes in intergenic, promoter, and intragenic regions, as defined in Figure 2B. (D) Enrichment of biological processes in each category of EtOH-YPD dynamic nucleosomes.
Figure 5.
The current sequencing depth is not saturated for the detection of dynamic nucleosomes. Counts or functional enrichment _Q_-values of genes containing dynamic nucleosomes on promoters were plotted as a function of sequencing depth. The sequencing depth is estimated by the read counts multiplied by the nucleosome unit size (200 bp) and divided by the yeast genome size (12 Mb). The biological processes “energy generation by precursor metabolites” (GO:0006091) and “hexose metabolic process” (GO:0019318) were used to estimate the function enrichment of EtOH-YPD and Gal-YPD dynamic nucleosomes, respectively.
Figure 6.
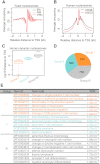
DANPOS defines functional dynamic nucleosomes in both promoter proximal and distal regions in the human genome. (A) Average nucleosome occupancy plotted as a function of distance to the nearest yeast TSS. (B) Average nucleosome occupancy plotted as a function of distance to the nearest human TSS. (C) Boxplots showing relative distance of human dynamic nucleosome to the nearest TSS. The dynamic nucleosomes during differentiation of human hematopoietic stem cells (HSCs) to CD36+ cells were divided into three groups. (D) Pie chart showing the number of human dynamic nucleosomes in each group. (E) Enrichment of function terms for each group. GREAT (Mclean et al. 2010) was used to analyze the functional significance of dynamic nucleosomes in each group.
Similar articles
- An approach of identifying differential nucleosome regions in multiple samples.
Liu L, Xie J, Sun X, Luo K, Qin ZS, Liu H. Liu L, et al. BMC Genomics. 2017 Feb 7;18(1):135. doi: 10.1186/s12864-017-3541-9. BMC Genomics. 2017. PMID: 28173752 Free PMC article. - Analyses of Promoter , Enhancer, and Nucleosome Organization in Mammalian Cells by MNase-Seq.
Esnault C, Magat T, García-Oliver E, Andrau JC. Esnault C, et al. Methods Mol Biol. 2021;2351:93-104. doi: 10.1007/978-1-0716-1597-3_5. Methods Mol Biol. 2021. PMID: 34382185 - Blurring of high-resolution data shows that the effect of intrinsic nucleosome occupancy on transcription factor binding is mostly regional, not local.
Goh WS, Orlov Y, Li J, Clarke ND. Goh WS, et al. PLoS Comput Biol. 2010 Jan 22;6(1):e1000649. doi: 10.1371/journal.pcbi.1000649. PLoS Comput Biol. 2010. PMID: 20098497 Free PMC article. - Genomic studies and computational predictions of nucleosome positions and formation energies.
Tolkunov D, Morozov AV. Tolkunov D, et al. Adv Protein Chem Struct Biol. 2010;79:1-57. doi: 10.1016/S1876-1623(10)79001-5. Adv Protein Chem Struct Biol. 2010. PMID: 20621280 Review. - Nucleosome positioning: resources and tools online.
Teif VB. Teif VB. Brief Bioinform. 2016 Sep;17(5):745-57. doi: 10.1093/bib/bbv086. Epub 2015 Sep 26. Brief Bioinform. 2016. PMID: 26411474 Review.
Cited by
- Noninvasive prediction of axillary lymph node status in breast cancer using promoter profiling of circulating cell-free DNA.
Guo ZW, Liu Q, Yang X, Cai GX, Han BW, Huang LM, Li CX, Liang ZK, Zhai XM, Lin L, Li K, Zhang M, Liu TC, Pan RL, Wu YS, Yang XX. Guo ZW, et al. J Transl Med. 2022 Dec 3;20(1):557. doi: 10.1186/s12967-022-03724-w. J Transl Med. 2022. PMID: 36463222 Free PMC article. - CHD6 promotes broad nucleosome eviction for transcriptional activation in prostate cancer cells.
Zhao D, Zhang M, Huang S, Liu Q, Zhu S, Li Y, Jiang W, Kiss DL, Cao Q, Zhang L, Chen K. Zhao D, et al. Nucleic Acids Res. 2022 Nov 28;50(21):12186-12201. doi: 10.1093/nar/gkac1090. Nucleic Acids Res. 2022. PMID: 36408932 Free PMC article. - The plant POLYMERASE-ASSOCIATED FACTOR1 complex links transcription and H2B monoubiquitination genome wide.
Blanco-Touriñán N, Pérez-Alemany J, Bourbousse C, Latrasse D, Ait-Mohamed O, Benhamed M, Barneche F, Blázquez MA, Gallego-Bartolomé J, Alabadí D. Blanco-Touriñán N, et al. Plant Physiol. 2024 Apr 30;195(1):640-651. doi: 10.1093/plphys/kiae041. Plant Physiol. 2024. PMID: 38285074 Free PMC article. - Chromatin accessibility profiling methods.
Minnoye L, Marinov GK, Krausgruber T, Pan L, Marand AP, Secchia S, Greenleaf WJ, Furlong EEM, Zhao K, Schmitz RJ, Bock C, Aerts S. Minnoye L, et al. Nat Rev Methods Primers. 2021;1:10. doi: 10.1038/s43586-020-00008-9. Epub 2021 Jan 21. Nat Rev Methods Primers. 2021. PMID: 38410680 Free PMC article. - RYBP stimulates PRC1 to shape chromatin-based communication between Polycomb repressive complexes.
Rose NR, King HW, Blackledge NP, Fursova NA, Ember KJ, Fischer R, Kessler BM, Klose RJ. Rose NR, et al. Elife. 2016 Oct 5;5:e18591. doi: 10.7554/eLife.18591. Elife. 2016. PMID: 27705745 Free PMC article.
References
- Bai FW, Anderson WA, Moo-Young M 2008. Ethanol fermentation technologies from sugar and starch feedstocks. Biotechnol Adv 26: 89–105 - PubMed
Publication types
MeSH terms
Substances
Grants and funding
- PC094421/PC/NCI NIH HHS/United States
- R00 CA168983/CA/NCI NIH HHS/United States
- R01 CA095641/CA/NCI NIH HHS/United States
- R01 GM064475/GM/NIGMS NIH HHS/United States
- HG004840/HG/NHGRI NIH HHS/United States
- R01 HG004840/HG/NHGRI NIH HHS/United States
LinkOut - more resources
Full Text Sources
Other Literature Sources


