Proinsulin intermolecular interactions during secretory trafficking in pancreatic β cells - PubMed (original) (raw)
Proinsulin intermolecular interactions during secretory trafficking in pancreatic β cells
Leena Haataja et al. J Biol Chem. 2013.
Abstract
Classically, exit from the endoplasmic reticulum (ER) is rate-limiting for secretory protein trafficking because protein folding/assembly occurs there. In this study, we have exploited "hPro-CpepSfGFP," a human proinsulin bearing "superfolder" green fluorescent C-peptide expressed in pancreatic β cells where it is processed to human insulin and CpepSfGFP. Remarkably, steady-state accumulation of hPro-CpepSfGFP and endogenous proinsulin is in the Golgi region, as if final stages of protein folding/assembly were occurring there. The Golgi regional distribution of proinsulin is dynamic, influenced by fasting/refeeding, and increased with β cell zinc deficiency. However, coexpression of ER-entrapped mutant proinsulin-C(A7)Y shifts the steady-state distribution of wild-type proinsulin to the ER. Endogenous proinsulin coprecipitates with hPro-CpepSfGFP and even more so with hProC(A7)Y-CpepSfGFP. Using Cerulean and Venus-tagged proinsulins, we find that both WT-WT and WT-mutant proinsulin pairs exhibit FRET. The data demonstrate that wild-type proinsulin dimerizes within the ER but accumulates at a poorly recognized slow step within the Golgi region, reflecting either slow kinetics of proinsulin hexamerization, steps in formation of nascent secretory granules, or other unknown molecular events. However, in the presence of ongoing misfolding of a subpopulation of proinsulin in β cells, the rate-limiting step in transport of the remaining proinsulin shifts to the ER.
Figures
FIGURE 1.
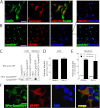
Expression of endogenous proinsulin and hPro-CpepSfGFP in INS1 cells. A, parental INS1 cells were processed for double-label immunofluorescence with guinea pig anti-insulin that cross-reacts with proinsulin (green) and mouse mAb anti-proinsulin that does not cross-react with insulin (red; a merged image is also shown, right panel). Confocal microscopy, scale bar = 10 μm. B, parental INS1 cells were processed for triple-label immunofluorescence with rabbit polyclonal anti-membrin (an ER-to-Golgi SNARE protein, green), Alexa Fluor 555-conjugated mouse anti-GM130 (a Golgi matrix protein, red), and a mouse mAb anti-proinsulin that does not cross-react with insulin (blue). A merged pairwise image is also shown (right panel). Scale bar = 20 μm. C, parental INS1 cells or GRINCH cells (INS1 cells stably expressing hPro-CpepSfGFP) or INS cells expressing hProC(A7)Y-CpepSfGFP were plated in 12-well plates. The bathing media were collected after 18 h, and the cells were lysed. All samples were then resolved by reducing SDS-PAGE in 4–12% acrylamide gradient gels and electrotransfer to nitrocellulose for direct immunoblotting (WB) with anti-GFP. Note that hPro-CpepSfGFP shows processing to CpepSfGFP (a recombinant CpepSfGFP standard is shown at the left) as well as extensive secretion. Human insulin content (D) and insulin secretion (E) after unstimulated (2.8 m
m
glucose, open bars) and stimulated (16.7 m
m
glucose, closed bars) collections from GRINCH and INS832/13 (832/13) cells. Human insulin RIA is specific for processed, mature, human insulin, and this comprises 6–8% of total proinsulin + insulin of all species in GRINCH and 832/13 cells. Data from three independent measurements are shown. Data are mean ± S.D. F, GRINCH cells were transiently transfected to express an ER-targeted RFP-KDEL (ER-RFP). Note that hPro-CpepSfGFP (green) exhibits a dual distribution in the juxtanuclear region as well as in cell processes and subjacent to the cell membrane. Neither of these distributions matches that of ER-RFP (red). Both DAPI nuclear staining and a merged image are shown. Scale bar = 10 μm.
FIGURE 2.
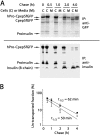
Processing and secretion of hPro-CpepSfGFP and endogenous proinsulin in GRINCH cells. A, GRINCH cells were labeled with pure 35S-Cys for 0.5 h and then chased for the indicated times. At each chase time, cell lysate (C) and medium (M) were immunoprecipitated (IP) and resolved by reducing SDS-PAGE in 4–12% acrylamide gradient gels and analyzed by phosphorimaging. Upper panel, anti-GFP. Lower panel, anti-insulin. Note that under these conditions, the insulin A-chain is not retained on the gel. In anti-GFP immunoprecipitates, a weak band migrating midway between hPro-CpepSfGFP and CpepSfGFP is a presumptive endoproteolytic processing intermediate. This band was not consistently recovered with anti-insulin. B, intracellular transport rate of hPro-CpepSfGFP (■) was estimated from the data in A by the fraction that had been processed intracellularly to CpepSfGFP plus that secreted (regardless of processing, see text). An analogous estimate was made for the intracellular transport rate of authentic proinsulin (○). For each kind of proinsulin, the estimated untransported fraction was plotted and, assuming first-order kinetics of intracellular protein transport, a half-time of export was calculated. The data points represent the mean and range from two independent measurements.
FIGURE 3.
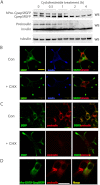
Trafficking of hPro-CpepSfGFP in GRINCH cells. A, GRINCH cells were incubated with cycloheximide (10 μg/ml, for protein synthesis inhibition) for the indicated times. At each time the cells were lysed, and the samples were resolved by reducing SDS-PAGE in 4–12% acrylamide gradient gels with electrotransfer to nitrocellulose for Western blotting (WB) with anti-GFP (upper panel), anti-insulin (center panel), or anti-tubulin (lower panel). Note the disappearance of both hPro-CpepSfGFP and proinsulin over the 4-h time course. B–D, images obtained by confocal microscopy. Scale bar = 20 μm. B, GRINCH cells were plated on chamber slides and were incubated 48 h later without (Con) or with cycloheximide (+CHX) for 4 h before fixation. The cells were processed for immunofluorescence with anti-insulin (blue) and anti-calnexin (red). C, the same cells were processed with anti-proinsulin (red). D, INS1 cells were transiently transfected with hProC(A7)Y-CpepSfGFP, fixed, and processed with anti-proinsulin. Endogenous proinsulin is clearly juxtanuclear in untransfected cells and shifts to an ER staining pattern in cells coexpressing misfolded mutant proinsulin.
FIGURE 4.
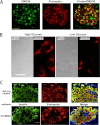
Juxtanuclear distribution of proinsulin in islet β cells and hPro-CpepSfGFP in GRINCH cells. A, pancreata from overnight fasted and 6-h refed mice were immunostained for GM130 (green) and proinsulin (red). A merged image is shown (right panel). Proinsulin colocalizes with the Golgi marker but also shows a blush of immunofluorescence from the ER pool. Controls proved that secondary antibody added in the second round did not cross over and react with mouse primary antibody from the first round (data not shown). B, GRINCH cells were cultured in high (16.7 m
m
) or low (2.8 m
m
) glucose-containing medium for 4 h, fixed, and processed for immunofluorescence with anti-proinsulin. Scale bar = 20 μm. C, paraffin blocks of _Ins2_-Cre (RIP-Cre) control male (upper panels) and litter mate ZnT8BKO (β cell-specific ZnT8 knockout mice, lower panels) were sectioned, deparaffinized, and processed for immunofluorescence with anti-insulin (green) and anti-proinsulin (red). Merged images, including nuclear staining (blue), are shown in the right panels. Note the expanded juxtanuclear distribution of proinsulin in the ZnT8BKO β cells.
FIGURE 5.
Wild-type and mutant hPro-CpepSfGFP coprecipitate endogenous proinsulin. A, GRINCH (GR) and hProC(A7)Y-CpepSfGFP (A7) cells were either lysed and resolved by reducing SDS-PAGE in 4–12% acrylamide gradient gels and electrotransfer to nitrocellulose for direct immunoblotting (WB) with anti-insulin (second set of lanes) or immunoprecipitated (IP) with anti-GFP antibodies before proceeding with the same immunoblotting analysis (first set of lanes). Note that hProC(A7)Y-CpepSfGFP cells do not have increased intracellular proinsulin, yet anti-GFP immunoprecipitation selectively coprecipitates endogenous proinsulin from hProC(A7)Y-CpepSfGFP cells. B, parental INS1 (INS), GRINCH, and hProC(A7)Y-CpepSfGFP cells were labeled with 35S-Met/Cys for 30 min, chased for the first 2 h under unstimulated (low glucose) conditions, and then stimulated with secretagogue (Stim: +) for another 2 h. The media were collected, and the cells were lysed at the indicated chase times. The samples were immunoprecipitated with anti-GFP antibodies (lanes 1–18, lanes 5 and 10 are blanks), resolved using reducing SDS-PAGE in 4–12% acrylamide gradient gels, and analyzed by phosphorimaging. As a control for the positions of hPro-CpepSfGFP and proinsulin bands, INS1 and GRINCH cells were labeled with 35S-Met/Cys for 1 h and immunoprecipitated with anti-insulin (lanes 19 and 20). Note that after stimulation, processed CpepSfGFP was robustly secreted from GRINCH cells (lane 9). In lanes 21-26, cells were labeled and chased, and samples were collected as before, but the 4-h media and cell lysates were combined into a single sample to generate total (T). Anti-GFP immunoprecipitates samples were then reboiled in SDS, diluted into complete immunoprecipitation buffer, reimmunoprecipitated with anti-insulin, resolved using SDS-PAGE in 4–12% acrylamide gradient gels, and analyzed by phosphorimaging. Note that coprecipitation (co-ppt) of endogenous proinsulin became undetectable after a 4-h chase (lanes 7, 13, 14, and 26). The identities of the two bands marked with asterisks are unknown. C, parental INS1, GRINCH, and hProC(A7)Y-CpepSfGFP cells were labeled with 35S-Met/Cys as in B but either lysed immediately or chased for 4 h in the presence of 10 μ
m
MG132 before immunoprecipitation with anti-GFP and analysis as in B. Loss of proinsulin coprecipitation with hProC(A7)Y-SfCpepGFP was at least in part related to ERAD because some endogenous proinsulin could still be coprecipitated at 4 h in cells treated with MG132 (arrow at right). In contrast, loss of the weak endogenous proinsulin coprecipitation with hPro-CpepSfGFP in GRINCH cells corresponds to processing to insulin and CpepSfGFP, consistent with Fig. 2_A_.
FIGURE 6.
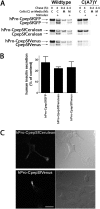
Expression of hPro-CpepSfGFP bearing a carboxyl-terminal KDEL sequence. A, U2OS cells were transiently transfected with hPro-CpepSfGFP either not bearing (upper panels) or bearing a KDEL retrieval sequence (center panels). INS1 cells were similarly transfected with hPro-CpepGFP bearing a carboxyl-terminal KDEL (lower panels), and each transfection was processed for indirect immunofluorescence of the Golgi marker p115 (Ref. , antibody from Dr. D. Shields, Albert Einstein College of Medicine) as well as direct green fluorescence. The inset shows that in INS1 cells with a smaller rounder morphology, the Golgi appears as a unique circular-shaped structure that is decorated with the KDEL-tagged green fluorescent proinsulin. Merged images are shown in the right panels. Scale bar = 10 μm. B, INS1 cells were transiently transfected with hPro-CpepSfGFP, hPro-CpepSfGFP bearing a carboxyl-terminal KDEL retrieval signal, or hProC(A7)Y-CpepSfGFP. Samples were processed exactly as in Fig. 1_C_.
FIGURE 7.
Expression of hPro-CpepSfGFP, hPro-CpepSfCerulean or hPro-CpepSfVenus in INS1 cells. A, INS1 cells transiently transfected with wild-type hPro-CpepSfGFP (upper panels), hPro-CpepSfCerulean (center panels), or hPro-CpepSfVenus (lower panels) not bearing (left panels) or bearing the C(A7)Y point mutation (right panels) were labeled with 35S-Met/Cys for 30 min, chased for 2 h under unstimulated (low glucose) conditions, and then chased for another 2 h in the presence of stimulus before final cell lysis. Each sample was immunoprecipitated with anti-GFP, resolved by reducing SDS-PAGE on 4–12% acrylamide gradient gels, and analyzed by phosphorimaging. B, INS1 cells transiently transfected with hPro-CpepSfGFP, hPro-CpepSfCerulean, or hPro-CpepSfVenus were plated in 12-well plates. At 20 h post-transfection, the bathing medium was replaced and collected for a further 18 h, and the cells were lysed. The fractional secretion of human insulin was measured by specific RIA. Data represent the mean ± S.D. from three independent experiments. C, INS1 cells transiently transfected to express hPro-CpepSfCerulean or hPro-CpepSfVenus as in A were treated with cycloheximide as in Fig. 3_B_. Phase micrographs (right panels) contain fields of cells including those expressing direct blue (upper panels) or yellow fluorescent (lower panels) proteins. Both products accumulated in cell processes, indicating secretory granule accumulation. Scale bar = 20 μm.
FIGURE 8.
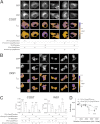
Interactions of hPro-Cpep and hProC(A7)Y-Cpep in living cells as determined by FRET. A and B, hPro-Cpep and hProC(A7)Y-Cpep fusions with SfCerulean and SfVenus were cotransfected into COS7 (A) and INS1 cells (B) in the indicated combinations along with ER-localized control protein. Cells were observed by fluorescence polarization microscopy 6 h post-transfection for COS7 cells and 24 h post-transfection for Ins1 cells. The top two rows of images display cyan (CFP) and yellow fluorescence (YFP), and the bottom two rows display the calculated anisotropies (r) for the CFP and FRET images (cyan excitation, yellow emission). Reduction in the FRET channel anisotropy (orange) relative to the cyan anisotropy indicates FRET. Non-cellular regions in the anisotropy images were masked for clarity (black). Scale bar = 10 μm. C, the difference between fluorescence anisotropies in CFP and FRET channels was calculated from image data obtained in COS7 and INS1 cells. Significant FRET was observed between homotypic and heterotypic expression of proinsulin constructs in both cell types but not when either construct was coexpressed with an ER-localized control plasmid. n = 10 cells per group; *, p < 0.05, **, p < 0.01; ***, p < 0.001, Student's t test versus 0. D, to look at the relative strength of protein-protein interactions between hPro-CpepSfVenus or hProC(A7)Y-CpepSfVenus homotypic pairs, fusion protein overexpression was achieved in COS7 cells by waiting 17 h post-transfection. Homotransfer FRET is indicated by a reduction in SfVenus anisotropy and was observed with less relative fluorescence (expressed in arbitrary units) for hProC(A7)Y-CpepSfVenus compared with hPro-Cpep-SfVenus, consistent with an increased affinity (analysis of variance, Tukey multiple comparison test versus lowest detectable expression, n ≥ 3 cells for each point. *, p < 0.05; ***, p < 0.001). Bars indicate mean ± S.E. for B and C.
Similar articles
- Monitoring C-Peptide Storage and Secretion in Islet β-Cells In Vitro and In Vivo.
Zhu S, Larkin D, Lu S, Inouye C, Haataja L, Anjum A, Kennedy R, Castle D, Arvan P. Zhu S, et al. Diabetes. 2016 Mar;65(3):699-709. doi: 10.2337/db15-1264. Epub 2015 Dec 8. Diabetes. 2016. PMID: 26647386 Free PMC article. - Proinsulin entry and transit through the endoplasmic reticulum in pancreatic beta cells.
Liu M, Wright J, Guo H, Xiong Y, Arvan P. Liu M, et al. Vitam Horm. 2014;95:35-62. doi: 10.1016/B978-0-12-800174-5.00002-8. Vitam Horm. 2014. PMID: 24559913 Review. - Biological behaviors of mutant proinsulin contribute to the phenotypic spectrum of diabetes associated with insulin gene mutations.
Wang H, Saint-Martin C, Xu J, Ding L, Wang R, Feng W, Liu M, Shu H, Fan Z, Haataja L, Arvan P, Bellanné-Chantelot C, Cui J, Huang Y. Wang H, et al. Mol Cell Endocrinol. 2020 Dec 1;518:111025. doi: 10.1016/j.mce.2020.111025. Epub 2020 Sep 8. Mol Cell Endocrinol. 2020. PMID: 32916194 Free PMC article. - Endoplasmic reticulum stress response in an INS-1 pancreatic beta-cell line with inducible expression of a folding-deficient proinsulin.
Hartley T, Siva M, Lai E, Teodoro T, Zhang L, Volchuk A. Hartley T, et al. BMC Cell Biol. 2010 Jul 26;11:59. doi: 10.1186/1471-2121-11-59. BMC Cell Biol. 2010. PMID: 20659334 Free PMC article. - Biosynthesis, structure, and folding of the insulin precursor protein.
Liu M, Weiss MA, Arunagiri A, Yong J, Rege N, Sun J, Haataja L, Kaufman RJ, Arvan P. Liu M, et al. Diabetes Obes Metab. 2018 Sep;20 Suppl 2(Suppl 2):28-50. doi: 10.1111/dom.13378. Diabetes Obes Metab. 2018. PMID: 30230185 Free PMC article. Review.
Cited by
- "Register-shift" insulin analogs uncover constraints of proteotoxicity in protein evolution.
Rege NK, Liu M, Dhayalan B, Chen YS, Smith NA, Rahimi L, Sun J, Guo H, Yang Y, Haataja L, Phillips NFB, Whittaker J, Smith BJ, Arvan P, Ismail-Beigi F, Weiss MA. Rege NK, et al. J Biol Chem. 2020 Mar 6;295(10):3080-3098. doi: 10.1074/jbc.RA119.011389. Epub 2020 Jan 31. J Biol Chem. 2020. PMID: 32005662 Free PMC article. - The protein kinase PERK/EIF2AK3 regulates proinsulin processing not via protein synthesis but by controlling endoplasmic reticulum chaperones.
Sowers CR, Wang R, Bourne RA, McGrath BC, Hu J, Bevilacqua SC, Paton JC, Paton AW, Collardeau-Frachon S, Nicolino M, Cavener DR. Sowers CR, et al. J Biol Chem. 2018 Apr 6;293(14):5134-5149. doi: 10.1074/jbc.M117.813790. Epub 2018 Feb 14. J Biol Chem. 2018. PMID: 29444822 Free PMC article. - Disruption of O-linked N-Acetylglucosamine Signaling Induces ER Stress and β Cell Failure.
Alejandro EU, Bozadjieva N, Kumusoglu D, Abdulhamid S, Levine H, Haataja L, Vadrevu S, Satin LS, Arvan P, Bernal-Mizrachi E. Alejandro EU, et al. Cell Rep. 2015 Dec 22;13(11):2527-2538. doi: 10.1016/j.celrep.2015.11.020. Epub 2015 Dec 8. Cell Rep. 2015. PMID: 26673325 Free PMC article. - Nutrient Regulation of Pancreatic Islet β-Cell Secretory Capacity and Insulin Production.
Rohli KE, Boyer CK, Blom SE, Stephens SB. Rohli KE, et al. Biomolecules. 2022 Feb 20;12(2):335. doi: 10.3390/biom12020335. Biomolecules. 2022. PMID: 35204835 Free PMC article. Review. - Reinterpretation of the localization of the ATP binding cassette transporter ABCG1 in insulin-secreting cells and insights regarding its trafficking and function.
Harris MT, Hussain SS, Inouye CM, Castle AM, Castle JD. Harris MT, et al. PLoS One. 2018 Sep 20;13(9):e0198383. doi: 10.1371/journal.pone.0198383. eCollection 2018. PLoS One. 2018. PMID: 30235209 Free PMC article.
References
- Orci L., Ravazzola M., Amherdt M., Madsen O., Vassalli J. D. (1985) Direct identification of prohormone conversion site in insulin-secreting cells. Cell 42, 671–681 - PubMed
- Lodish H. F. (1988) Transport of secretory and membrane glycoproteins from the rough endoplasmic reticulum to the Golgi. A rate-limiting step in protein maturation and secretion. J. Biol. Chem. 263, 2107–2110 - PubMed
- Scheuner D., Vander Mierde D., Song B., Flamez D., Creemers J. W., Tsukamoto K., Ribick M., Schuit F. C., Kaufman R. J. (2005) Control of mRNA translation preserves endoplasmic reticulum function in β cells and maintains glucose homeostasis. Nat. Med. 11, 757–764 - PubMed
Publication types
MeSH terms
Substances
Grants and funding
- R01-DK088856/DK/NIDDK NIH HHS/United States
- R01 DK088856/DK/NIDDK NIH HHS/United States
- R01 DK048280/DK/NIDDK NIH HHS/United States
- T32 GM008322/GM/NIGMS NIH HHS/United States
- P60 DK020572/DK/NIDDK NIH HHS/United States
- P30 DK020572/DK/NIDDK NIH HHS/United States
- R01-DK48280/DK/NIDDK NIH HHS/United States
- R01 DK077140/DK/NIDDK NIH HHS/United States
- R01-DK077140/DK/NIDDK NIH HHS/United States
- F30 DK095504/DK/NIDDK NIH HHS/United States
- MOP-102588/CIHR/Canada
- R01-GM086530/GM/NIGMS NIH HHS/United States
- R01 GM086530/GM/NIGMS NIH HHS/United States
LinkOut - more resources
Full Text Sources
Other Literature Sources
Medical
Research Materials
