Autonomous and self-sustained circadian oscillators displayed in human islet cells - PubMed (original) (raw)
. 2013 Mar;56(3):497-507.
doi: 10.1007/s00125-012-2779-7. Epub 2012 Dec 15.
T Mannic, D Sage, L Giovannoni, P Salmon, S Lemeille, M Giry-Laterriere, M Unser, D Bosco, C Bauer, J Morf, P Halban, J Philippe, C Dibner
Affiliations
- PMID: 23242133
- PMCID: PMC3563957
- DOI: 10.1007/s00125-012-2779-7
Autonomous and self-sustained circadian oscillators displayed in human islet cells
P Pulimeno et al. Diabetologia. 2013 Mar.
Abstract
Aims/hypothesis: Following on from the emerging importance of the pancreas circadian clock on islet function and the development of type 2 diabetes in rodent models, we aimed to examine circadian gene expression in human islets. The oscillator properties were assessed in intact islets as well as in beta cells.
Methods: We established a system for long-term bioluminescence recording in cultured human islets, employing lentivector gene delivery of the core clock gene Bmal1 (also known as Arntl)-luciferase reporter. Beta cells were stably labelled using a rat insulin2 promoter fluorescent construct. Single-islet/cell oscillation profiles were measured by combined bioluminescence-fluorescence time-lapse microscopy.
Results: Human islets synchronised in vitro exhibited self-sustained circadian oscillations of Bmal1-luciferase expression at both the population and single-islet levels, with period lengths of 23.6 and 23.9 h, respectively. Endogenous BMAL1 and CRY1 transcript expression was circadian in synchronised islets over 48 h, and antiphasic to REV-ERBα (also known as NR1D1), PER1, PER2, PER3 and DBP transcript circadian profiles. HNF1A and PDX1 exhibited weak circadian oscillations, in phase with the REV-ERBα transcript. Dispersed islet cells were strongly oscillating as well, at population and single-cell levels. Importantly, beta and non-beta cells revealed oscillatory profiles that were well synchronised with each other.
Conclusions/interpretation: We provide for the first time compelling evidence for high-amplitude cell-autonomous circadian oscillators displayed in human pancreatic islets and in dispersed human islet cells. Moreover, these clocks are synchronised between beta and non-beta cells in primary human islet cell cultures.
Figures
Fig. 1
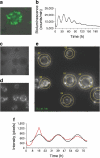
Cell-autonomous oscillators in human pancreatic islets. (a) Bmal1-luc and CMV-GFP co-expression in whole islets. Whole islets were co-transduced with lentiviral particles expressing Bmal1-luc and CMV-GFP constructs. Four days after infection, GFP expression evaluation was performed in n = 20 islets from two donors (ten islets from each donor). At least half of the cells were GFP positive in all visualised islets (representative CMV-GFP transduced islet is shown). (b) Bmal1-luc oscillation profile in synchronised islets. Islets were synchronised with dexamethasone and Bmal1-luc bioluminescence was recorded using an Actimetric Lumicycler for 200 h. Bmal1-luc oscillation profiles were recorded for three parallel dishes for each donor, total of five donors. (c, d) Individual islet circadian bioluminescence recording (ESM Video 1, left). Human islets were cultured on 804G matrix-covered dishes and transduced with Bmal1-luc viral particles. (c) Differential interference contrast (DIC) image. (d) Bioluminescence channel from the time-lapse microscopy images. (e) Trajectories of seven individual islets image by adapted CGE application (image corresponds to ESM Video 1, right). (f) Representative individual islet profile: the raw data (red curve) and the fitted sinusoid (black curve) are shown
Fig. 2
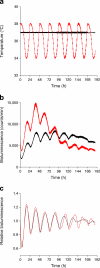
In vitro entrainment of human islets by simulated body temperature cycles. Human islets transduced with Bmal1-luc reporters were synchronised by dexamethasone and maintained at constant 37°C temperature (black line), or continuously entrained by simulated body temperature cycles (red line). (a) Temperature measurements throughout bioluminescence recordings in dishes of dexamethasone-synchronised (black) and temperature-entrained (red) islets. (b) Raw Bmal1-luc traces of dexamethasone-synchronised (black) and temperature-entrained (red) islets. (c) Same data as in (b), which has been detrended as described in the Methods (_y_-axis shows detrended bioluminescence)
Fig. 3
Oscillation of clock genes (a–i) and functional genes (j–l) in human islets. qPCR was performed in whole islets for core clock genes (a) BMAL1, (b) CRY1, (c) CRY2, (d) REV-ERBα, (e) CLOCK, (f) clock output gene DBP, (g) PER1, (h) PER2 and (i) PER3 and for islet functional genes (j) HNF1A, (k) PDX1 and (l) INSULIN transcripts, normalised to GAPDH and 9S house-keeping genes. Each time point represents 1,000 islets. Profiles are representative of three experiments (mean ± SEM), each using islets from one donor
Fig. 4
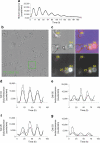
Beta and non-beta cells possess cell-autonomous clocks. (a) Oscillation profiles of dexamethasone-synchronised human islet cells transduced with Bmal1-luc encoding lentiviral particles. Bmal1-luc oscillation profiles were recorded for three parallel dishes for each of the five donors. (b) Representative full DIC image (512 × 512 pixels) of human islet cells attached to a Wilco glass bottom dish and subjected to time-lapse bioluminescence/fluorescence microscopy (ESM Video 2). (c) Four analysed cells, No. 04, No. 05, No. 09 and No. 27, overlaid on a zoomed 76 × 76 pixel patch (corresponding to the green square in [b], ESM Video 3). Light-grey panel, DIC image; dark-grey panel, image taken with the red fluorescence channel (RIP-tomato expression); black panel, image taken with the bioluminescence channel (Bmal1-luc expression); lilac panel, composite image of all three channels. Representative trajectories (cell No. 04 and No. 09) are overlaid in white over the DIC image. (d, e) Bioluminescence expression profiles of two representative beta cells, No. 04 and No. 05, with average tomato expression intensity of 14,720 and 8,735 pixels/cell, respectively (threshold for beta cells: 8,000 pixels/cell). The zone between 6,000 and 8,000 pixels/cell was considered ‘unclassified’. The raw data and the fitted sinusoid curve (bold curve) are shown in the profiles of both cells. (f, g) Bioluminescence expression profiles of cell No. 26 and No. 03 (ESM Video 2). Both cells are considered to be non-beta cells with average tomato intensity below 6,000 pixels/cell. The raw data and the fitted sinusoid curve (bold curve) are shown in the profiles of both cells
Similar articles
- MicroRNAs modulate core-clock gene expression in pancreatic islets during early postnatal life in rats.
Jacovetti C, Rodriguez-Trejo A, Guay C, Sobel J, Gattesco S, Petrenko V, Saini C, Dibner C, Regazzi R. Jacovetti C, et al. Diabetologia. 2017 Oct;60(10):2011-2020. doi: 10.1007/s00125-017-4348-6. Epub 2017 Jul 4. Diabetologia. 2017. PMID: 28674733 - Differential patterns in the periodicity and dynamics of clock gene expression in mouse liver and stomach.
Mazzoccoli G, Francavilla M, Pazienza V, Benegiamo G, Piepoli A, Vinciguerra M, Giuliani F, Yamamoto T, Takumi T. Mazzoccoli G, et al. Chronobiol Int. 2012 Dec;29(10):1300-11. doi: 10.3109/07420528.2012.728662. Epub 2012 Nov 6. Chronobiol Int. 2012. PMID: 23131081 - Identification of a Circadian Clock in the Inferior Colliculus and Its Dysregulation by Noise Exposure.
Park JS, Cederroth CR, Basinou V, Meltser I, Lundkvist G, Canlon B. Park JS, et al. J Neurosci. 2016 May 18;36(20):5509-19. doi: 10.1523/JNEUROSCI.3616-15.2016. J Neurosci. 2016. PMID: 27194331 Free PMC article. - Time zones of pancreatic islet metabolism.
Petrenko V, Philippe J, Dibner C. Petrenko V, et al. Diabetes Obes Metab. 2018 Sep;20 Suppl 2:116-126. doi: 10.1111/dom.13383. Diabetes Obes Metab. 2018. PMID: 30230177 Review. - Role of the clock gene Rev-erbα in metabolism and in the endocrine pancreas.
Vieira E, Merino B, Quesada I. Vieira E, et al. Diabetes Obes Metab. 2015 Sep;17 Suppl 1:106-14. doi: 10.1111/dom.12522. Diabetes Obes Metab. 2015. PMID: 26332975 Review.
Cited by
- Minireview: Toward the establishment of a link between melatonin and glucose homeostasis: association of melatonin MT2 receptor variants with type 2 diabetes.
Karamitri A, Renault N, Clement N, Guillaume JL, Jockers R. Karamitri A, et al. Mol Endocrinol. 2013 Aug;27(8):1217-33. doi: 10.1210/me.2013-1101. Epub 2013 Jun 24. Mol Endocrinol. 2013. PMID: 23798576 Free PMC article. Review. - Adapting Physiology in Functional Human Islet Organogenesis.
Yoshihara E. Yoshihara E. Front Cell Dev Biol. 2022 Apr 26;10:854604. doi: 10.3389/fcell.2022.854604. eCollection 2022. Front Cell Dev Biol. 2022. PMID: 35557947 Free PMC article. - Circadian rhythms and pancreas physiology: A review.
Chan K, Wong FS, Pearson JA. Chan K, et al. Front Endocrinol (Lausanne). 2022 Aug 10;13:920261. doi: 10.3389/fendo.2022.920261. eCollection 2022. Front Endocrinol (Lausanne). 2022. PMID: 36034454 Free PMC article. Review. - The role of melatonin in the treatment of type 2 diabetes mellitus and Alzheimer's disease.
Shen S, Liao Q, Wong YK, Chen X, Yang C, Xu C, Sun J, Wang J. Shen S, et al. Int J Biol Sci. 2022 Jan 1;18(3):983-994. doi: 10.7150/ijbs.66871. eCollection 2022. Int J Biol Sci. 2022. PMID: 35173531 Free PMC article. Review. - Alteration in glucose homeostasis and persistence of the pancreatic clock in aged mPer2Luc mice.
Novosadová Z, Polidarová L, Sládek M, Sumová A. Novosadová Z, et al. Sci Rep. 2018 Aug 3;8(1):11668. doi: 10.1038/s41598-018-30225-y. Sci Rep. 2018. PMID: 30076390 Free PMC article.
References
Publication types
MeSH terms
Substances
LinkOut - more resources
Full Text Sources
Other Literature Sources


