Highly coordinated proteome dynamics during reprogramming of somatic cells to pluripotency - PubMed (original) (raw)
Highly coordinated proteome dynamics during reprogramming of somatic cells to pluripotency
Jenny Hansson et al. Cell Rep. 2012.
Abstract
Generation of induced pluripotent stem cells (iPSCs) is a process whose mechanistic underpinnings are only beginning to emerge. Here, we applied in-depth quantitative proteomics to monitor proteome changes during the course of reprogramming of fibroblasts to iPSCs. We uncover a two-step resetting of the proteome during the first and last 3 days of reprogramming, with multiple functionally related proteins changing in expression in a highly coordinated fashion. This comprised several biological processes, including changes in the stoichiometry of electron transport-chain complexes, repressed vesicle-mediated transport during the intermediate stage, and an EMT-like process in the late phase. In addition, we demonstrate that the nucleoporin Nup210 is essential for reprogramming by its permitting of rapid cellular proliferation and subsequent progression through MET. Along with the identification of proteins expressed in a stage-specific manner, this study provides a rich resource toward an enhanced mechanistic understanding of cellular reprogramming.
Copyright © 2012 The Authors. Published by Elsevier Inc. All rights reserved.
Figures
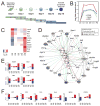
Figure 1. (A) Experimental design of the study
Reprogramming was induced by expressing Oct4, Klf4, Sox2 and c-Myc. Cells were isolated at 3-day intervals by FACS sorting based on Thy1, SSEA-1 and GFP-Oct4 expression, followed by a quantitative proteomic analysis by pairwise comparison of two consecutive time-points. See also Fig. S1A. (B–F) Expression of transcription factors during reprogramming. (B) Expression profiles of the reprogramming factors. The average log2 expression change to day 0 +/− SEM for the transcription factors that were used to initiate reprogramming. C-Myc was not covered by the data, possibly because it is refractory to tryptic digestion. (C) Expression patterns of proteins in the core regulatory circuit associated with pluripotency. (D) Network of induced transcription factors that interact with the reprogramming factors. Increased expression early, transient or late is depicted in gray-scale. (E–F) Number of differentially expressed proteins that are targets of Oct4, Sox2, Klf4 or c-Myc (E) and other TFs (F). See also Figure S1.
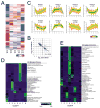
Figure 2. Proteome dynamics during reprogramming. (A) Heat map showing expression changes along reprogramming
The row-clustered heatmap represents standardized average protein log2 ratios for all 5601 proteins quantified at all time-point comparisons, in both replicates. Note that most changes occur early and late. (B) Strong expression changes early and late show opposing direction. Log2 ratios of proteins with strong expression change both early and late during reprogramming (fold change >2 and ratio count ≥2 in both replicates from day 0 to day 3 and day 12 to day 15) are shown, together with the Pearson correlation coefficient. (C) Clusters of the protein dynamics along reprogramming. For the 5601 proteins quantified at all time-points (in both replicates), the ratio relative to day 0 was standardized and proteins were subjected to unsupervised clustering. An upper and lower ratio limit of log2(0.5) and log2(−0.5) was used for inclusion into a cluster. ‘n’ indicates the number of proteins within each cluster. Membership value represents how well the protein profile fit the average cluster profile. (D–E) Representative overrepresented biological processes and cellular components of the clusters. Each cluster from C was tested for overrepresented GO Biological Processes (D) and GO Cellular Components (E) compared to unregulated proteins. See also Figure S2.
Figure 3. (A) Overrepresented network processes for protein expression changes early and late
Proteins with expression change (fold change >1.4 (|0.5| on log2-scale)) both early and late during reprogramming, were tested for overrepresented network processes. Displayed network processes were found overrepresented (p<0.01) both early and late. Note that no process was overrepresented for proteins whose expression decreased both from day 0 to day 3 and day 12 to iPS. (B) Temporal expression profiles of proteins related to EMT and MET. (C) Temporal expression profiles of proteins related to cytoskeletal organization and ECM proteins. See also Figure S3.
Figure 4. Proteins within complexes or with related function showing exceptionally similar dynamics along reprogramming
The significance of expression profile similarities within groups of interest was assessed using the R package proteinProfiles. (A) Examples of protein complexes or protein families for which the proteins show similar dynamics with statistical significance (all examples have p<0.015). (B) Clustering of mitochondrial and cytoplasmic ribosomal proteins. Similarities in expression profiles showed statistical significance within all four ribosomal subunits (28S and 39S (mitochondrial) and 40S and 60S (cytoplasmic)) (maximal p-value was 0.0005). The proteins of all four subunits were grouped by unsupervised clustering based on expression changes. Mitochondrial and cytoplasmic are indicated in green and purple, respectively.
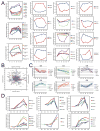
Figure 5. (A) Functionally related proteins with opposing expression profile along reprogramming
Curves show mean+/− SEM of log2 expression change relative to day 0. (B–C) Principal component analysis reveals candidate proteins contributing particularly to a specific time-point. A PCA was applied to the approximated abundances (iBAQ) of each protein at each time-point. Proteins with probable high contribution to each time-point are highlighted in the biplot (B) and their temporal expression profiles shown in (C), with the same color-coding as in (B). (D) Proteins with a stage-specific expression pattern. Temporal expression profiles for examples of proteins with strong change (>fold 1.5) in at least one of the intermediate time-point comparisons, and only low change (<1.3-fold) or absence day 0 to day 3. Curves show mean +−/SEM of log2 expression change to day 0.
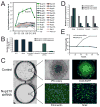
Figure 6. Nup210 is required for reprogramming. (A) Protein xxpression profile of nucleoporins
Curves show mean+/− SEM of log2 expression change relative to day 0. (B–E) Nup210 was depleted (using shRNA) in secondary MEF cells during reprogramming to iPS cells. (B) Number of colonies (mean+/− SD) in controls and Nup210 knocked-down cells are shown, for two independent Nup210 shRNAs. (C) While many Oct4-EGFP colonies developed in the controls, Nup210-knock down cells showed expression of Fibronectin and the mesenchymal marker Snail after 15 days of reprogramming. Upper panel shows iPS colony formation for control cells, and lower panel the Nup210 knock-down cells and their expression of Fibronectin and Snail at day 15 after induction of reprogramming. Scale bar represents 100 μm. For Snail expression, the border of the nucleus (defined by Hoechst staining, see Figure S4) is shown in blue, demonstrating that virtually all cells retain a mesenchymal phenotype. (D) Relative gene expression (mean+/− SD) in control and Nup210 knocked-down cells 15 days after reprogramming. (E) Growth curve for control and Nup210-knock down MEFs.
Figure 7. Model of highly coordinated proteome dynamics during reprogramming
Protein upregulation and downregulation is shown in red and blue, respectively, where color intensity reflects the degree of regulation. Examples are given of individual proteins that are expressed or repressed in a stage-specific manner.
Similar articles
- Single cell analysis reveals the stochastic phase of reprogramming to pluripotency is an ordered probabilistic process.
Chung KM, Kolling FW 4th, Gajdosik MD, Burger S, Russell AC, Nelson CE. Chung KM, et al. PLoS One. 2014 Apr 17;9(4):e95304. doi: 10.1371/journal.pone.0095304. eCollection 2014. PLoS One. 2014. PMID: 24743916 Free PMC article. - Screening of Human cDNA Library Reveals Two differentiation-Related Genes, HHEX and HLX, as Promoters of Early Phase Reprogramming toward Pluripotency.
Yamakawa T, Sato Y, Matsumura Y, Kobayashi Y, Kawamura Y, Goshima N, Yamanaka S, Okita K. Yamakawa T, et al. Stem Cells. 2016 Nov;34(11):2661-2669. doi: 10.1002/stem.2436. Epub 2016 Jul 8. Stem Cells. 2016. PMID: 27335261 - The Effect of Fetal Bovine Serum (FBS) on Efficacy of Cellular Reprogramming for Induced Pluripotent Stem Cell (iPSC) Generation.
Kwon D, Kim JS, Cha BH, Park KS, Han I, Park KS, Bae H, Han MK, Kim KS, Lee SH. Kwon D, et al. Cell Transplant. 2016;25(6):1025-42. doi: 10.3727/096368915X689703. Epub 2015 Oct 7. Cell Transplant. 2016. PMID: 26450367 - Mitochondrial resetting and metabolic reprogramming in induced pluripotent stem cells and mitochondrial disease modeling.
Hsu YC, Chen CT, Wei YH. Hsu YC, et al. Biochim Biophys Acta. 2016 Apr;1860(4):686-93. doi: 10.1016/j.bbagen.2016.01.009. Epub 2016 Jan 15. Biochim Biophys Acta. 2016. PMID: 26779594 Review. - mTOR-regulated senescence and autophagy during reprogramming of somatic cells to pluripotency: a roadmap from energy metabolism to stem cell renewal and aging.
Menendez JA, Vellon L, Oliveras-Ferraros C, Cufí S, Vazquez-Martin A. Menendez JA, et al. Cell Cycle. 2011 Nov 1;10(21):3658-77. doi: 10.4161/cc.10.21.18128. Epub 2011 Nov 1. Cell Cycle. 2011. PMID: 22052357 Review.
Cited by
- The corepressor NCOR1 and OCT4 facilitate early reprogramming by suppressing fibroblast gene expression.
Peñalosa-Ruiz G, Mulder KW, Veenstra GJC. Peñalosa-Ruiz G, et al. PeerJ. 2020 Apr 22;8:e8952. doi: 10.7717/peerj.8952. eCollection 2020. PeerJ. 2020. PMID: 32351783 Free PMC article. - Metabolic determinants of embryonic development and stem cell fate.
Folmes CD, Terzic A. Folmes CD, et al. Reprod Fertil Dev. 2014 Dec;27(1):82-8. doi: 10.1071/RD14383. Reprod Fertil Dev. 2014. PMID: 25472047 Free PMC article. Review. - Notch and Wnt Signaling Modulation to Enhance DPSC Stemness and Therapeutic Potential.
Uribe-Etxebarria V, Pineda JR, García-Gallastegi P, Agliano A, Unda F, Ibarretxe G. Uribe-Etxebarria V, et al. Int J Mol Sci. 2023 Apr 17;24(8):7389. doi: 10.3390/ijms24087389. Int J Mol Sci. 2023. PMID: 37108549 Free PMC article. Review. - The ubiquitin ligase Cullin5SOCS2 regulates NDR1/STK38 stability and NF-κB transactivation.
Paul I, Batth TS, Iglesias-Gato D, Al-Araimi A, Al-Haddabi I, Alkharusi A, Norstedt G, Olsen JV, Zadjali F, Flores-Morales A. Paul I, et al. Sci Rep. 2017 Feb 20;7:42800. doi: 10.1038/srep42800. Sci Rep. 2017. PMID: 28216640 Free PMC article. - Stem Cell Metabolism: Powering Cell-Based Therapeutics.
Rigaud VOC, Hoy R, Mohsin S, Khan M. Rigaud VOC, et al. Cells. 2020 Nov 16;9(11):2490. doi: 10.3390/cells9112490. Cells. 2020. PMID: 33207756 Free PMC article. Review.
References
- Ahmed N, Maines-Bandiera S, Quinn MA, Unger WG, Dedhar S, Auersperg N. Molecular pathways regulating EGF-induced epithelio-mesenchymal transition in human ovarian surface epithelium. Am J Physiol Cell Physiol. 2006;290:C1532–1542. - PubMed
- Boekema EJ, Braun HP. Supramolecular structure of the mitochondrial oxidative phosphorylation system. J Biol Chem. 2007;282:1–4. - PubMed
- Boersema PJ, Raijmakers R, Lemeer S, Mohammed S, Heck AJ. Multiplex peptide stable isotope dimethyl labeling for quantitative proteomics. Nat Protoc. 2009;4:484–494. - PubMed
Publication types
MeSH terms
Substances
LinkOut - more resources
Full Text Sources
Other Literature Sources
Miscellaneous


