Decreased parkin solubility is associated with impairment of autophagy in the nigrostriatum of sporadic Parkinson's disease - PubMed (original) (raw)
Decreased parkin solubility is associated with impairment of autophagy in the nigrostriatum of sporadic Parkinson's disease
I Lonskaya et al. Neuroscience. 2013.
Abstract
Parkinson's disease (PD) is a motor disorder that involves death of dopaminergic neurons in the substantia nigra pars compacta. Parkin is an autosomal recessive gene that is mutated in early onset PD. We investigated the role of parkin and autophagic clearance in postmortem nigrostriatal tissues from 22 non-familial sporadic PD patients and 15 control samples. Parkin was insoluble with altered cytosolic expression in the nigrostriatum of sporadic PD. Parkin insolubility was associated with lack of degradation of ubiquitinated proteins and accumulation of α-Synuclein and parkin in autophagosomes, suggesting autophagic defects in PD. To test parkin's role in mediating autophagic clearance, we used lentiviral gene transfer to express human wild type or mutant parkin (T240R) with α-Synuclein in the rat striatum. Lentiviral expression of α-Synuclein led to accumulation of autophagic vacuoles, while co-expression of parkin with α-Synuclein facilitated autophagic clearance. Subcellular fractionation showed accumulation of α-Synuclein and tau hyper-phosphorylation (p-Tau) in autophagosomes in gene transfer models, similar to the effects observed in PD brains, but parkin expression led to protein deposition into lysosomes. However, parkin loss of function mutation did not affect autophagic clearance. Taken together, these data suggest that functional parkin regulates autophagosome clearance, while decreased parkin solubility may alter normal autophagy in sporadic PD.
Copyright © 2012 IBRO. Published by Elsevier Ltd. All rights reserved.
Conflict of interest statement
Conflicts of interest: The authors declare no conflict of interest whatsoever in association with this manuscript.
Figures
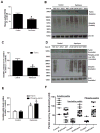
Figure 1. Parkin is insoluble in post-mortem striatum of human PD patients
A). Histograms represent ELISA measurement of human parkin in the caudate of PD patients and control subjects. B). WB analysis on 4–12% SDS-NuPAGE gel of soluble human post-mortem striatal lysates in PD patients and control subjects, showing parkin (1st blot) and ubiquitinated proteins (2nd blot) compared to actin loading control. C). Histograms represent quantification of blots. D). WB analysis on 4–12% SDS NuPAGE gel showing the levels of insoluble parkin (1st blot), phospho-parkin (2nd blot), ubiquitinated proteins (3rd blot), and actin (4th blot). E). Histograms represent quantification of blots. Asterisks indicate significantly different. F). Box plot represents individual samples of human PD patients and age-matched controls. Histograms are mean±SD expressed as % to control. ANOVA, Neumann Keuls with multiple comparison, or non-parametirc t-Test. P<0.05. N=12 PD patients and 7 control subjects.
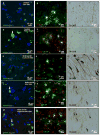
Figure 2. Immunostaining of human tissues with human parkin, and GFAP antibodies
Immunostaining of 20 μm thick paraffin embedded serially sectioned brains with A). human anti-parkin (PRK8) staining and counterstaining with nuclear marker DAPI showing cytosolic protein, B). co-staining with parkin and glial marker GFAP showing parkin expression in astrocytes, C). TH staining in the caudate of a control subject. D). Parkin staining and counterstaining with nuclear marker DAPI showing cytosolic protein, E). co-staining with parkin and glial marker GFAP showing parkin expression in astrocytes, F). TH staining in the caudate of a PD/AD patient. G). Parkin staining and counterstaining with DAPI showing cytosolic protein, H). co-staining with parkin and glial marker GFAP showing parkin expression in astrocytes, I). TH staining in the midbrain/SN of a control subject. J). Parkin staining and counterstaining with DAPI showing cytosolic protein, K). co-staining with parkin and glial marker GFAP showing parkin expression in astrocytes, L). TH staining in the midbrain/SN of a PD patient. M). human anti-parkin (AB5112) staining and counterstaining with nuclear marker DAPI showing cytosolic protein, N). co-staining with parkin and glial marker GFAP showing parkin expression in astrocytes, O). TH staining in the caudate of a control subject.
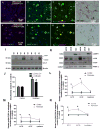
Figure 3. Subcellular fractionation in frozen human PD brain tissues
A). human anti-parkin (AB5112) staining and counterstaining with nuclear marker DAPI showing cytosolic protein, B). neuronal marker MAP-2 staining and DAPI and C). merged parkin and MAP-2 in serial sections stained with D). TH in the midbrain/SN of a control subject. E). human anti-parkin (AB5112) staining and counterstaining with nuclear marker DAPI showing cytosolic protein, F). neuronal marker MAP-2 staining and DAPI and G). merged parkin and MAP-2 in serial sections stained with H). TH in the midbrain/SN of a PD with Dementia patient. I). WB analysis on 4–12% SDS NuPAGE gel of human striatal lysates showing expression of LC3-I and LC3-II (first panel), LC3-B (second panel) compared to actin loading control (bottom panel) J). Histograms represent densitometry analysis of blots. K). Western blot in subcellular extracts showing LC3-B in AV-10 and AV-20 and LAMP-3 in lysosomal fraction, as well as mitochondrial marker COX-IV and nuclear marker PARP-1. Graphs represent subcellular fractionation and ELISA measurement of L). human α-Synuclein, M). human parkin and N). human p-Tau (AT8). Asterisks indicate significantly different to control. ANOVA, Neumann Keuls with multiple comparison, P<0.05. N=12 PD patients and 7 control subjects.
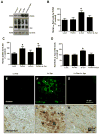
Figure 4. Lentiviral expression of α-Synuclein leads to p-Tau and parkin reverses these effects
A). WB analysis on 4–12% SDS-NuPAGE gel of rat striatal extracts showing levels of parkin (top blot) and α-Synuclein (middle blot) expression and actin levels (lower blot). B). Histograms represent quantification of human α-Synuclein levels by ELISA. C). Histograms represent quantification of human parkin activity. D). ELISA measurement of rat p-Tau. Thioflavin-S staining of 20 μm striatal sections in lentiviral E). parkin, F) α-Synuclein and G). parkin+α-Synuclein injected brains. Human α-Synuclein staining of 20 μm sections cut serially with the thioflavin-S sections in lentiviral K). parkin, L) α-Synuclein and M). parkin+α-Synuclein injected brains. Asterisks indicate significantly different. Histograms are mean±SD expressed as % control. ANOVA, Neumann Keuls with multiple comparison, P<0.05. N=8 animals per treatment for WB and ELISA, 8 for IHC.
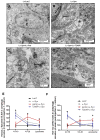
Figure 5. Wild type, but not T240R, parkin reverses α-Synuclein_-induced accumulation of autophagosomes_
Electron micrographs of striatal sections in rat brains injected with A). Lentiviral LacZ (Lv-LacZ) as control, B). Lentiviral α-Synuclein (Lv-Syn), C). Lentiviral parkin + lentiviral-α-Synuclein (Lv-Syn+Lv-Par), vacuoles contain debris and D). Lentiviral α-Synuclein + lentiviral T240R (Lv-Syn+Lv-T240R), asterisk indicates autophagic vacuoles. N=8. Graphs represent subcellular fractionation and ELISA measurement of E). α-Synuclein and F). p-Tau in gene transfer animal models. ANOVA, Neumann Keuls with multiple comparison, P<0.05. N=5 animals per treatment for subcellular fractionation.
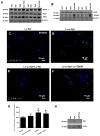
Figure 6. Functional parkin, not mutant T240R, reverses α_-Synuclein alteration of normal autophagy._
A). WB analysis on 4–12% SDS NuPAGE gel of rat striatal lysates showing expression of beclin-1 (first panel), Atg7 (second panel) and Atg12 (third panel) compared to actin loading control (bottom panel) in animals injected with Lv-LacZ, Lv-Par, Lv-Syn and Lv-Par+Lv-Syn. B). WB analysis of rat striatal brain lysates showing expression of LC3-B (first panel), and HDAC6 (second panel) compared to actin loading control (bottom panel) in animals injected with Lv-LacZ, Lv-Par, Lv-Syn and Lv-Par+Lv-Syn. Staining of 20 μm thick cortical brain sections injected with C). Lentiviral parkin (Lv-Par), D), Lentiviral α-Synuclein (Lv-Syn) E). Lentiviral parkin + lentiviral α-Synuclein (Lv-Par+Lv-Syn) and F). Lentiviral T240R + lentiviral α-Synuclein (Lv-T240R+Lv-Syn). G). Histograms represent stereological counting of LC3-B positive cells in the striatum. F). Western blot analysis on 4–12% SDS NuPAGE gel with P62 antibody. Asterisks indicate significantly different. Histograms are mean±SD converted to % control. ANOVA, Neumann Keuls with multiple comparison, P<0.05. N=8 animals per treatment for WB and ELISA, 8 for IHC.
Similar articles
- Diminished parkin solubility and co-localization with intraneuronal amyloid-β are associated with autophagic defects in Alzheimer's disease.
Lonskaya I, Shekoyan AR, Hebron ML, Desforges N, Algarzae NK, Moussa CE. Lonskaya I, et al. J Alzheimers Dis. 2013;33(1):231-47. doi: 10.3233/JAD-2012-121141. J Alzheimers Dis. 2013. PMID: 22954671 - Ubiquitination increases parkin activity to promote autophagic α-synuclein clearance.
Lonskaya I, Desforges NM, Hebron ML, Moussa CE. Lonskaya I, et al. PLoS One. 2013 Dec 26;8(12):e83914. doi: 10.1371/journal.pone.0083914. eCollection 2013. PLoS One. 2013. PMID: 24386307 Free PMC article. - Lentiviral vector delivery of parkin prevents dopaminergic degeneration in an alpha-synuclein rat model of Parkinson's disease.
Lo Bianco C, Schneider BL, Bauer M, Sajadi A, Brice A, Iwatsubo T, Aebischer P. Lo Bianco C, et al. Proc Natl Acad Sci U S A. 2004 Dec 14;101(50):17510-5. doi: 10.1073/pnas.0405313101. Epub 2004 Dec 2. Proc Natl Acad Sci U S A. 2004. PMID: 15576511 Free PMC article. - The interplay between parkin and alpha-synuclein; possible implications for the pathogenesis of Parkinson's disease.
Jęśko H, Lenkiewicz AM, Wilkaniec A, Adamczyk A. Jęśko H, et al. Acta Neurobiol Exp (Wars). 2019;79(3):276-289. Acta Neurobiol Exp (Wars). 2019. PMID: 31587020 Review. - The regulatory role of α-synuclein and parkin in neuronal cell apoptosis; possible implications for the pathogenesis of Parkinson's disease.
Yasuda T, Mochizuki H. Yasuda T, et al. Apoptosis. 2010 Nov;15(11):1312-21. doi: 10.1007/s10495-010-0486-8. Apoptosis. 2010. PMID: 20221696 Review.
Cited by
- Selective dopaminergic vulnerability in Parkinson's disease: new insights into the role of DAT.
Harraz MM. Harraz MM. Front Neurosci. 2023 Aug 24;17:1219441. doi: 10.3389/fnins.2023.1219441. eCollection 2023. Front Neurosci. 2023. PMID: 37694119 Free PMC article. Review. - CSF MicroRNAs Reveal Impairment of Angiogenesis and Autophagy in Parkinson Disease.
Fowler AJ, Ahn J, Hebron M, Chiu T, Ayoub R, Mulki S, Ressom H, Torres-Yaghi Y, Wilmarth B, Pagan FL, Moussa C. Fowler AJ, et al. Neurol Genet. 2021 Nov 12;7(6):e633. doi: 10.1212/NXG.0000000000000633. eCollection 2021 Dec. Neurol Genet. 2021. PMID: 34786477 Free PMC article. - Tyrosine Kinase Inhibition Regulates Early Systemic Immune Changes and Modulates the Neuroimmune Response in α-Synucleinopathy.
Hebron ML, Lonskaya I, Olopade P, Selby ST, Pagan F, Moussa CE. Hebron ML, et al. J Clin Cell Immunol. 2014 Sep 30;5:259. doi: 10.4172/2155-9899.1000259. J Clin Cell Immunol. 2014. PMID: 25635231 Free PMC article. - Tyrosine kinase inhibition increases functional parkin-Beclin-1 interaction and enhances amyloid clearance and cognitive performance.
Lonskaya I, Hebron ML, Desforges NM, Franjie A, Moussa CE. Lonskaya I, et al. EMBO Mol Med. 2013 Aug;5(8):1247-62. doi: 10.1002/emmm.201302771. Epub 2013 Jul 4. EMBO Mol Med. 2013. PMID: 23737459 Free PMC article. - Alteration of Autophagy and Glial Activity in Nilotinib-Treated Huntington's Disease Patients.
Anderson KE, Stevenson M, Varghese R, Hebron ML, Koppel E, McCartin M, Kuprewicz R, Matar S, Ferrante D, Moussa C. Anderson KE, et al. Metabolites. 2022 Dec 6;12(12):1225. doi: 10.3390/metabo12121225. Metabolites. 2022. PMID: 36557263 Free PMC article.
References
- Avraham E, Rott R, Liani E, Szargel R, Engelender S. Phosphorylation of Parkin by the cyclin-dependent kinase 5 at the linker region modulates its ubiquitin-ligase activity and aggregation. J Biol Chem. 2007;282:12842–12850. - PubMed
- Clark IE, Dodson MW, Jiang C, Cao JH, Huh JR, Seol JH, Yoo SJ, Hay BA, Guo M. Drosophila pink1 is required for mitochondrial function and interacts genetically with parkin. Nature. 2006;441:1162–1166. - PubMed
Publication types
MeSH terms
Substances
LinkOut - more resources
Full Text Sources
Other Literature Sources
Miscellaneous
