The promoter-search mechanism of Escherichia coli RNA polymerase is dominated by three-dimensional diffusion - PubMed (original) (raw)
The promoter-search mechanism of Escherichia coli RNA polymerase is dominated by three-dimensional diffusion
Feng Wang et al. Nat Struct Mol Biol. 2013 Feb.
Abstract
Gene expression, DNA replication and genome maintenance are all initiated by proteins that must recognize specific targets from among a vast excess of nonspecific DNA. For example, to initiate transcription, Escherichia coli RNA polymerase (RNAP) must locate promoter sequences, which compose <2% of the bacterial genome. This search problem remains one of the least understood aspects of gene expression, largely owing to the transient nature of search intermediates. Here we visualize RNAP in real time as it searches for promoters, and we develop a theoretical framework for analyzing target searches at the submicroscopic scale on the basis of single-molecule target-association rates. We demonstrate that, contrary to long-held assumptions, the promoter search is dominated by three-dimensional diffusion at both the microscopic and submicroscopic scales in vitro, which has direct implications for understanding how promoters are located within physiological settings.
Figures
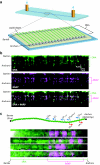
Fig. 1. Single–molecule DNA curtain assay for promoter–specific binding by RNA polymerase
(a) Double–tethered DNA curtain assay for organizing substrates on surfaces of a microfluidic device. (b) Two–color images of YOYO1–stained DNA (green) bound by QD–RNAP (magenta). (c) Schematic of the λ–phage genome (48.5–kb), including relative locations and orientations of promoters aligned with images of QD–RNAP on single DNA molecules (Supplementary Table 2). As shown in (b–c) most RNAP is bound to the promoters, and the left half of the λ–DNA that lacks promoters is essentially devoid of bound proteins. The finding that RNAP can locate promoters on stretched DNA molecules eliminates intersegmental transfer as an obligatory component of the promoter search (Supplementary Fig. 1).
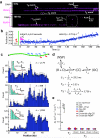
Fig. 2. Visualizing single molecules of RNA polymerase as they search for and engage promoters
(a) Kymograms of RNAP binding to λ–DNA showing kinetically distinct intermediates. DNA is unlabeled, and RNAP is magenta. (b) Representative example of RNAP binding and initiating transcription from λPR; for this assay RNAP was premixed with all four rNTPs immediately prior to injection into the sample chamber (also see Supplementary Fig. 4). Initial binding (t = 0 s) is indicated as ( ), and magenta bars highlight the first 3–9 seconds of the reaction trajectory. (c) Binding distributions of kinetically distinct intermediates, and corresponding lifetime measurements (insets; also see Supplementary Fig. 2 & Supplementary Fig. 2); a schematic showing the relative promoter location is included. Error bars indicate 70% confidence intervals obtained through bootstrap analysis.(d) Kinetic scheme reflecting observed intermediates. NSP, CC, and OC, refer to nonspecifically bound, closed complex, and open complex, respectively; note that CC could also represent another intermediate preceding the open complex. Kinetic parameters are not segregated for individual promoters, rather they are considered collectively, and therefore reported values should be considered an average of all λ promoters. (e) Upper bound of observed diffusion coefficients for promoter–bound RNAP, compared to immobilized dig–QDs and other proteins known to undergo 1D–diffusion (Supplementary Fig. 7–8 & Supplementary Table 4).,, Diffusion coefficients are gamma distributed, therefore we report the magnitude of the square root of the variance as error bars (n ≥ 50 for all data sets).
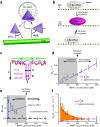
Fig. 3. Single–molecule kinetics reveal the promoter search is dominated by 3D–diffusion
(a) Influence of protein orientation on target association. The angle _θ_0 defines the effective DNA–binding surface of QD–RNAP, and θ defines the orientation of the effective binding surface relative to the promoter. (b) Illustration of linear target size (a), for example where a = 2–bp: a 1–bp offset (in either direction) results in target recognition, but a 2–bp offset does not result in target recognition. (c) Relationship between θ, a and ψ, and their influence on promoter recognition. (d) Observed promoter assocition rates (ka). Dashed magenta line corresponds to kα(ψ)(t) in the absence of faciliated diffusion (for ψ = 0.75–nm), and experimental values above this line reflect rate enhancement due to facilitated diffusion. The boundary between the shaded and unshaded regions of the graph represents the facilitation threshold (Cthr; as indicated). (e) Effective target size (ψ) versus RNAP concentration. The dashed black line highlights the limiting value of ψ. (f) Rate acceleration (ka/_C_0) versus RNAP concentration. The difference between the experimental values and kα(ψ)(t) reflects facilitated diffusion, and the orange shaded region represents the maximum possible acceleration due 1D–sliding and/or hopping. In (d–f) error bars represent S.E.M. (n ≥ 50 for each data point).
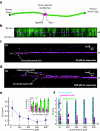
Fig. 4. Protein concentration exerts a dominant influence on target searches even for proteins capable of sliding on DNA
(a) DNA schematic showing the location of the 5x lac operator. (b) Two–color image of YOYO1–stained DNA (green) bound by QD–lac repressor (magenta). (c) Kymogram showing an example of lac repressor binding to nonspecific DNA and then diffusing in 1D to the operator; data were collected at 33 pM lac repressor. The distance between the initial binding site and the operator is indicated as Δ_x_. (d) Kymogram showing an example of direct operator binding in the absence of any detectable 1D sliding; data were collected at 800 pM lac repressor. The successful search through 3D binding is highlighted, as are examples of molecules that searched through FD but failed to locate the operator. (e) Graph showing the mean value of Δ_x_ as a function of protein concentration for proteins that successfully engage the operator. Inset, percentage of total operator binding events that are attributable to FD (magenta) and 3D (green) at each protein concentration. Error bars represent S.D. of the data (n ≥ 54 for each data point). (f) Graph of Δ_x_ for all observed proteins. Blue data points ( ) correspond to proteins that fail to bind the operator, magenta data points (
 ) are proteins that bind the operator after undergoing FD, and green data points (
 ) correspond 3D binding to the operator. All green data points within each column overlap at zero, but their fractional contribution to operator binding is shown as green bars in the inset of panel (e). These experiments were all conducted in buffer containing 10 mM Tris–HCl (pH 8.0), 1 mM MgCl2, 1 mM DTT, and 1 mg ml−1 BSA.
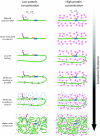
Fig. 5. Increasingly complex environments encountered during in vivo searches
Facilitated diffusion (FD) will be favored at concentrations below the facilitation threshold because the initial encounter with the DNA will most often occur at nonspecific sites, so the probability (P) of target engagement through FD exceeds the probability of engagement through 3D (PFD > P_3_D). Concentrations equal to or exceeding the facilitation threshold will favor 3D because the relative increase in protein abundance increases the probability of a direct collision with the target site (PFD > P_3_D). FD–related processes such as sliding/hopping can still occur at high protein concentrations, but those proteins undergoing FD are less likely to reach the target site before those that collide directly with the target. Although the facilitation threshold will vary for different proteins and different conditions, higher protein concentrations will still favor 3D collisions irrespective of the local environment (e.g. the presence of recruitment factors, DNA–bound obstacles, macromolecular crowding, local DNA folding) or global DNA architecture. See the Discussion for additional details.
Comment in
- Looking for a promoter in 3D.
Svetlov V, Nudler E. Svetlov V, et al. Nat Struct Mol Biol. 2013 Feb;20(2):141-2. doi: 10.1038/nsmb.2498. Nat Struct Mol Biol. 2013. PMID: 23381630 No abstract available.
Similar articles
- Looking for a promoter in 3D.
Svetlov V, Nudler E. Svetlov V, et al. Nat Struct Mol Biol. 2013 Feb;20(2):141-2. doi: 10.1038/nsmb.2498. Nat Struct Mol Biol. 2013. PMID: 23381630 No abstract available. - Modeling promoter search by E. coli RNA polymerase: one-dimensional diffusion in a sequence-dependent energy landscape.
Weindl J, Dawy Z, Hanus P, Zech J, Mueller JC. Weindl J, et al. J Theor Biol. 2009 Aug 7;259(3):628-34. doi: 10.1016/j.jtbi.2009.05.006. Epub 2009 May 20. J Theor Biol. 2009. PMID: 19463831 - Direct observation of one-dimensional diffusion and transcription by Escherichia coli RNA polymerase.
Guthold M, Zhu X, Rivetti C, Yang G, Thomson NH, Kasas S, Hansma HG, Smith B, Hansma PK, Bustamante C. Guthold M, et al. Biophys J. 1999 Oct;77(4):2284-94. doi: 10.1016/S0006-3495(99)77067-0. Biophys J. 1999. PMID: 10512846 Free PMC article. - RNA polymerase molecular beacon as tool for studies of RNA polymerase-promoter interactions.
Mekler V, Severinov K. Mekler V, et al. Methods. 2015 Sep 15;86:19-26. doi: 10.1016/j.ymeth.2015.04.033. Epub 2015 May 5. Methods. 2015. PMID: 25956222 Free PMC article. Review. - RNA polymerase structure and function at lac operon.
Borukhov S, Lee J. Borukhov S, et al. C R Biol. 2005 Jun;328(6):576-87. doi: 10.1016/j.crvi.2005.03.007. C R Biol. 2005. PMID: 15950164 Review.
Cited by
- Insight into Single-Molecule Imaging Techniques for the Study of Prokaryotic Genome Maintenance.
Sharma N, van Oijen AM, Spenkelink LM, Mueller SH. Sharma N, et al. Chem Biomed Imaging. 2024 Jun 18;2(9):595-614. doi: 10.1021/cbmi.4c00037. eCollection 2024 Sep 23. Chem Biomed Imaging. 2024. PMID: 39328428 Free PMC article. Review. - Molecular mechanisms of transcription through single-molecule experiments.
Dangkulwanich M, Ishibashi T, Bintu L, Bustamante C. Dangkulwanich M, et al. Chem Rev. 2014 Mar 26;114(6):3203-23. doi: 10.1021/cr400730x. Epub 2014 Feb 6. Chem Rev. 2014. PMID: 24502198 Free PMC article. Review. No abstract available. - Single-Stranded DNA Curtains for Studying Homologous Recombination.
Ma CJ, Steinfeld JB, Greene EC. Ma CJ, et al. Methods Enzymol. 2017;582:193-219. doi: 10.1016/bs.mie.2016.08.005. Epub 2016 Oct 22. Methods Enzymol. 2017. PMID: 28062035 Free PMC article. - Binding Revisited-Avidity in Cellular Function and Signaling.
Erlendsson S, Teilum K. Erlendsson S, et al. Front Mol Biosci. 2021 Jan 14;7:615565. doi: 10.3389/fmolb.2020.615565. eCollection 2020. Front Mol Biosci. 2021. PMID: 33521057 Free PMC article. Review. - Anticipating response function in gene regulatory networks.
Gautam P, Kumar Sinha S. Gautam P, et al. J R Soc Interface. 2021 Jun;18(179):20210206. doi: 10.1098/rsif.2021.0206. Epub 2021 Jun 2. J R Soc Interface. 2021. PMID: 34062105 Free PMC article.
References
- von Hippel P, Berg O. Facilitated target location in biological systems. J Biol Chem. 1989;264:675–8. - PubMed
- Gorman J, Greene EC. Visualizing one–dimensional diffusion of proteins along DNA. Nat Struct Mol Biol. 2008;15:768–74. - PubMed
- Browning D, Busby S. The regulation of bacterial transcription initiation. Nat Rev Microbiol. 2004;2:57–65. - PubMed
Publication types
MeSH terms
Substances
Grants and funding
- T32GM00879807/GM/NIGMS NIH HHS/United States
- F32 GM080864/GM/NIGMS NIH HHS/United States
- HHMI/Howard Hughes Medical Institute/United States
- R01 GM074739/GM/NIGMS NIH HHS/United States
- F32GM80864/GM/NIGMS NIH HHS/United States
- GM074739/GM/NIGMS NIH HHS/United States
- R00 GM097177/GM/NIGMS NIH HHS/United States
LinkOut - more resources
Full Text Sources
Other Literature Sources
