Data exploration, quality control and testing in single-cell qPCR-based gene expression experiments - PubMed (original) (raw)
Data exploration, quality control and testing in single-cell qPCR-based gene expression experiments
Andrew McDavid et al. Bioinformatics. 2013.
Abstract
Motivation: Cell populations are never truly homogeneous; individual cells exist in biochemical states that define functional differences between them. New technology based on microfluidic arrays combined with multiplexed quantitative polymerase chain reactions now enables high-throughput single-cell gene expression measurement, allowing assessment of cellular heterogeneity. However, few analytic tools have been developed specifically for the statistical and analytical challenges of single-cell quantitative polymerase chain reactions data.
Results: We present a statistical framework for the exploration, quality control and analysis of single-cell gene expression data from microfluidic arrays. We assess accuracy and within-sample heterogeneity of single-cell expression and develop quality control criteria to filter unreliable cell measurements. We propose a statistical model accounting for the fact that genes at the single-cell level can be on (and a continuous expression measure is recorded) or dichotomously off (and the recorded expression is zero). Based on this model, we derive a combined likelihood ratio test for differential expression that incorporates both the discrete and continuous components. Using an experiment that examines treatment-specific changes in expression, we show that this combined test is more powerful than either the continuous or dichotomous component in isolation, or a t-test on the zero-inflated data. Although developed for measurements from a specific platform (Fluidigm), these tools are generalizable to other multi-parametric measures over large numbers of events.
Availability: All results presented here were obtained using the SingleCellAssay R package available on GitHub (http://github.com/RGLab/SingleCellAssay).
Figures
Fig. 1.
Histogram and theoretical (normal) distribution of  for single-cell (left, light gray) and 100-cell experiments (right, dark gray). Genes FASLG, IFN-
  , BIRC3 and CD69 are depicted. The frequency expression of each gene in the single-cell experiments
  is printed above each histogram. The mean of the 100-cell and single-cell experiments is indicated by a thick black line along the _x_-axis
Fig. 2.
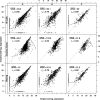
Concordance between 100 cell  and
and  , the in silico average of single-cell wells for datasets A, B and C. In the top row, wells with
  are included and treated as exact zeroes. In the middle row, they are excluded, resulting in a clear lack of concordance. In the final row, wells are filtered as per Section 2.3. Dark, thin lines show the initial location of a gene before filtering and connect to the location of the gene after filtering. In each panel,
  , the concordance correlation coefficient and
  , the average weighted squared deviation of expression measurements is printed. The dotted black line shows a loess fit through the data. In all cases, the expression values are transformed using a shifted log-transformation [
 ]. As such, a graphed value of zero corresponds to a zero expression value (i.e.
  )
)
Fig. 3.
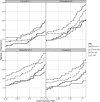
Number of discoveries (genes  units) versus FDR, by treatment, dataset A. The combined LRT is compared with a Bernoulli or normal-theory only LRT, as well as a _t_-test of the raw expression values (
 scale), including zero measurements
Fig. 4.
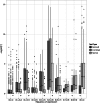
 of tests (genes
  units) versus frequencies of expression
  of the genes. The Bernoulli, normal-theory and combined LRTs are plotted. Asterisk indicates test is different from the combined test at 5% significance in a Wilcoxon signed-rank test
Fig. 5.
Heatmap of signed  for selected genes (rows, see main text) and all 16 individuals (columns). The color above each column indicates the antigen stimulation applied to the cells; thus, individuals are randomly arranged in each antigen block. Red and purple are two different CMV antigen pools; yellow and orange are two different HIV antigen pools
Similar articles
- Microdroplet-based one-step RT-PCR for ultrahigh throughput single-cell multiplex gene expression analysis and rare cell detection.
Ma J, Tran G, Wan AMD, Young EWK, Kumacheva E, Iscove NN, Zandstra PW. Ma J, et al. Sci Rep. 2021 Mar 24;11(1):6777. doi: 10.1038/s41598-021-86087-4. Sci Rep. 2021. PMID: 33762663 Free PMC article. - Quantitative miRNA expression analysis using fluidigm microfluidics dynamic arrays.
Jang JS, Simon VA, Feddersen RM, Rakhshan F, Schultz DA, Zschunke MA, Lingle WL, Kolbert CP, Jen J. Jang JS, et al. BMC Genomics. 2011 Mar 9;12:144. doi: 10.1186/1471-2164-12-144. BMC Genomics. 2011. PMID: 21388556 Free PMC article. - Validation of oligonucleotide microarray data using microfluidic low-density arrays: a new statistical method to normalize real-time RT-PCR data.
Abruzzo LV, Lee KY, Fuller A, Silverman A, Keating MJ, Medeiros LJ, Coombes KR. Abruzzo LV, et al. Biotechniques. 2005 May;38(5):785-92. doi: 10.2144/05385MT01. Biotechniques. 2005. PMID: 15945375 - Twenty-five years of quantitative PCR for gene expression analysis.
VanGuilder HD, Vrana KE, Freeman WM. VanGuilder HD, et al. Biotechniques. 2008 Apr;44(5):619-26. doi: 10.2144/000112776. Biotechniques. 2008. PMID: 18474036 Review. - Microfluidic single cell analysis: from promise to practice.
Lecault V, White AK, Singhal A, Hansen CL. Lecault V, et al. Curr Opin Chem Biol. 2012 Aug;16(3-4):381-90. doi: 10.1016/j.cbpa.2012.03.022. Epub 2012 Apr 21. Curr Opin Chem Biol. 2012. PMID: 22525493 Review.
Cited by
- Bacterial Internalization, Localization, and Effectors Shape the Epithelial Immune Response during Shigella flexneri Infection.
Lippmann J, Gwinner F, Rey C, Tamir U, Law HK, Schwikowski B, Enninga J. Lippmann J, et al. Infect Immun. 2015 Sep;83(9):3624-37. doi: 10.1128/IAI.00574-15. Epub 2015 Jun 29. Infect Immun. 2015. PMID: 26123804 Free PMC article. - Geometry of the Gene Expression Space of Individual Cells.
Korem Y, Szekely P, Hart Y, Sheftel H, Hausser J, Mayo A, Rothenberg ME, Kalisky T, Alon U. Korem Y, et al. PLoS Comput Biol. 2015 Jul 10;11(7):e1004224. doi: 10.1371/journal.pcbi.1004224. eCollection 2015 Jul. PLoS Comput Biol. 2015. PMID: 26161936 Free PMC article. - Exercise improves choroid plexus epithelial cells metabolism to prevent glial cell-associated neurodegeneration.
Chen Y, Luo Z, Sun Y, Li F, Han Z, Qi B, Lin J, Lin WW, Yao M, Kang X, Huang J, Sun C, Ying C, Guo C, Xu Y, Chen J, Chen S. Chen Y, et al. Front Pharmacol. 2022 Sep 16;13:1010785. doi: 10.3389/fphar.2022.1010785. eCollection 2022. Front Pharmacol. 2022. PMID: 36188600 Free PMC article. - Valid Post-clustering Differential Analysis for Single-Cell RNA-Seq.
Zhang JM, Kamath GM, Tse DN. Zhang JM, et al. Cell Syst. 2019 Oct 23;9(4):383-392.e6. doi: 10.1016/j.cels.2019.07.012. Epub 2019 Sep 11. Cell Syst. 2019. PMID: 31521605 Free PMC article. - Single-cell transcriptomes of murine bone marrow stromal cells reveal niche-associated heterogeneity.
Addo RK, Heinrich F, Heinz GA, Schulz D, Sercan-Alp Ö, Lehmann K, Tran CL, Bardua M, Matz M, Löhning M, Hauser AE, Kruglov A, Chang HD, Durek P, Radbruch A, Mashreghi MF. Addo RK, et al. Eur J Immunol. 2019 Sep;49(9):1372-1379. doi: 10.1002/eji.201848053. Epub 2019 Jun 7. Eur J Immunol. 2019. PMID: 31149730 Free PMC article.
References
- Ge Y, et al. Resampling-based multiple testing for microarray data analysis. TEST. 2003;12:1–77.
Publication types
MeSH terms
LinkOut - more resources
Full Text Sources
Other Literature Sources


