Neocortical somatostatin-expressing GABAergic interneurons disinhibit the thalamorecipient layer 4 - PubMed (original) (raw)
Neocortical somatostatin-expressing GABAergic interneurons disinhibit the thalamorecipient layer 4
Han Xu et al. Neuron. 2013.
Abstract
Subtypes of GABAergic interneurons (INs) are crucial for cortical function, yet their specific roles are largely unknown. In contrast to supra- and infragranular layers, where most somatostatin-expressing (SOM) INs are layer 1-targeting Martinotti cells, the axons of SOM INs in layer 4 of somatosensory cortex largely remain within layer 4. Moreover, we found that whereas layers 2/3 SOM INs target mainly pyramidal cells (PCs), layer 4 SOM INs target mainly fast-spiking (FS) INs. Accordingly, optogenetic inhibition of SOM INs in an active cortical network increases the firing of layers 2/3 PCs whereas it decreases the firing of layer 4 principal neurons (PNs). This unexpected effect of SOM INs on layer 4 PNs occurs via their inhibition of local FS INs. These results reveal a disinhibitory microcircuit in the thalamorecipient layer through interactions among subtypes of INs and suggest that the SOM IN-mediated disinhibition represents an important circuit mechanism for cortical information processing.
Copyright © 2013 Elsevier Inc. All rights reserved.
Figures
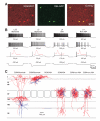
Figure 1. Layer 4 SOM INs in mouse somatosensory cortex are a single population with axons that mainly target layer 4
(A) Confocal image of RFP-expressing neurons (left), X94 neurons (middle) and their overlay (right) in layer 4 barrel cortex of an adult SOM-Cre/RFP/X94 mouse. Note that 3 out 6 SOM-RFP neurons in the image are X94 cells. (B) Representative membrane potential responses of subgroups of SOM INs to the indicated current injections. Note that the non-X94 SOM interneuron responded to current injections in a manner identical to the X94 cell. The traces in the third row show the responses at threshold current injection, and the insets illustrate the first action potential from the corresponding traces, shown at the same vertical scale and at a 200-fold expanded horizontal scale. Note the differences in spike width between layer 4 and layers 2/3 or 5 SOM INs. (C) Representative morphologies of reconstructed SOM INs. The SOM-expressing Martinotti cells (2 leftmost) from either infragranular or supragranular layers send their axons to layer 1 and branched extensively in this layer, however layer 4 SOM-expressing X94 cells (2 middle) and non-X94 cells (2 rightmost) confined their axons largely to layer 4. Soma and dendrites are shown in blue, axons in red. See also Figure S1.
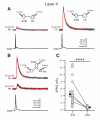
Figure 2. Layer 4 SOM INs preferentially inhibit FS INs
(A) Representative paired recordings between a layer 4 SOM interneuron and a PN (left) or a FS interneuron (right). Single action potentials in SOM INs (bottom) elicited IPSCs in the PN (top left; red, average of 10) or the FS interneuron (top right; red, average of 10). Note that the amplitude of the unitary IPSC in the FS interneuron is much larger than the one in the PN. (B) Representative triple recordings between a SOM interneuron and a PN and a FS interneuron. Single action potentials in the SOM interneuron (bottom) elicited IPSCs in both the PN (middle; red, average of 10) and the FS interneuron (top; red, average of 10). Note that the same SOM interneuron produced a unitary IPSC of larger amplitude in the FS cell. (C) Population results showing that SOM INs produced a significantly larger unitary inhibitory postsynaptic conductance (IPSG) in FS INs than in PNs. Data from triple recordings are connected by a line. Open symbols represent IPSGs of individual neurons, and filled symbols represent the mean IPSG. Error bars indicate s.e.m. The difference in IPSG between FS INs and PNs was highly significant (**** p < 0.0001, two sample t test). Schematics in A and B illustrate recording configurations.
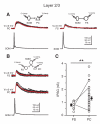
Figure 3. Layers 2/3 SOM INs preferentially inhibit PCs
(A) Representative paired recordings between a SOM interneuron and a PC (left) or a SOM interneuron and a FS cell (right). Single action potentials in the SOM interneuron elicited IPSCs in the PC (top left; red, average of 10) or the FS interneuron (top right; red, average of 10). Note that the amplitude of the unitary IPSC in the PC is larger than the IPSC in the FS interneuron. (B) Representative triple recordings between a SOM interneuron and a PC and a FS interneuron. Single action potentials in the SOM neuron induced IPSCs in both the PC (middle; red, average of 10) and the FS neuron (top; red, average of 10). Note that the same SOM interneuron produced a unitary IPSC of larger amplitude in the PC. (C) Population results showing that SOM INs produced a significantly larger IPSG in PCs than in FS INs. Data from triple recordings are connected by a line. Open symbols represent IPSGs of individual neurons, and filled symbols represent the mean IPSGs. Error bars indicate s.e.m. The difference of the IPSG in FS INs and PCs was significant (** p < 0.01, two sample t test). Schematics in A and B illustrate recording configurations. See also Figure S4.
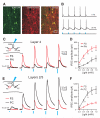
Figure 4. Layer and target cell type differential inhibition by SOM INs confirmed by optogenetic approach
(A) Confocal image of SOM-GFP neurons (left), ChR2- mCherry expression (middle) and the overlay (right) in barrel cortex of an adult SOM-Cre/RCE mice, showing that ChR2 expression was confined to SOM INs. (B) Brief photo stimulation reliably evoked action potentials in a ChR2-mCherry expressing SOM interneuron. Blue vertical bars represent photo stimulation (470 nm, 2 ms, 0.2 mW). (C) In layer 4, photostimulation (470 nm, 2 ms) of incremental intensity (0.2 to 1.0 mW at 0.2 mW steps) produced IPSCs of increasing amplitude in simultaneously recorded PN and FS cell, but the IPSC amplitude was larger in the FS interneuron at all light intensities. (E) In layer 2/3, photostimulation (470 nm, 2 ms) of incremental intensity (0.2 to 1.0 mW at 0.2 mW steps) produced IPSCs of increasing amplitude in the simultaneously recorded PC and FS neuron, but the IPSC amplitude was larger in the PC. (D, F) Population results showing layer and target-cell-type differential IPSC amplitude produced by photostimulation of ChR2-expressing SOM INs: in layer 4 IPSCs were significantly larger in FS INs (n = 7 pairs); in layers 2/3 IPSCs were significantly larger in PCs (n = 6 pairs). Open symbols represent the mean IPSCs. Error bars indicate s.e.m. * p < 0.05, ** p < 0.01, *** p < 0.001, paired t test. Schematics in C and E illustrate recording configurations. The spatial extent of efficient neuronal recruitment by the maximum photostimulation (470 nm, 2 ms, 1 mW) was about 200 μm in diameter under our experimental conditions (See also Figure S6).
Figure 5. Inhibition of SOM IN activity decreases firing of layer 4 PNs in an active network
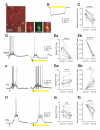
(A) Confocal images showing NpHR-YFP expression (green) was confined to SOM INs (red) in layer 4 barrel cortex of an adult SOM-Cre mouse. (B) Yellow light induced a large amplitude hyperpolarization in a layer 4 NpHR-YFP-expressing SOM interneuron. (C) Summary plot of the membrane potential of layer 4 NpHR-YFP-expressing SOM INs measured in the absence or presence of yellow light. (D) Yellow light reduced the spiking of a layer 4 NpHR-YFP-expressing SOM interneuron during a thalamus-triggered UP state due to the hyperpolarization induced by photostimulation. (E) Population results showing that yellow light nearly completely suppressed spiking activity of layer 4 NpHR-YFP-expressing SOM INs during UP states. (F) Yellow light increased spiking of a layer 4 FS interneuron during a thalamus-triggered UP state. (G) Population results showing that yellow light significantly increased spiking of FS INs during UP states. (H) Yellow light decreased spikes of a layer 4 PN during a thalamus-triggered UP state. (I) Population results showing that yellow light significantly decreased spiking of PNs during UP states. In B, D, F, and H, yellow bars represent photostimulation (591 nm, 1 s, 5 mW) and arrows represent thalamic stimulation. In C, E, G and I, data from the same cell are connected by a line. Open symbols represent the mean values for individual cells, and filled symbols represent mean values across cells. Error bars indicate s.e.m. ** p < 0.01, *** p < 0.001, paired t test.
Figure 6. Inhibition of PV INs increases firing of layer 4 PNs in an active network
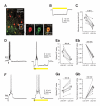
(A) Merged confocal image of NpHR-YFP-expressing neurons (green) and RFP-immunopositive neurons (red) in layer 4 barrel cortex of an adult PV-Cre-RFP reporter mouse. Note that NpHR-YFP expression occurs only in RFP-expressing PV INs. Boxed region is expanded to illustrate the overlay (yellow, right) of NpHR-YFP expression (green, middle) and RFP immunostaining (red, left). (B) Yellow light induced a large amplitude hyperpolarization in a layer 4 NpHR-YFP-expressing PV interneuron. (C) Summary plot of membrane potential of layer 4 NpHR-YFP-expressing PV INs measured in the absence or presence of yellow light. (D) Yellow light reduced spiking of a layer 4 NpHR-YFP-expressing PV interneuron during a thalamus-triggered UP state due to the large hyperpolarization induced by photostimulation. (E) Population results showing that yellow light potently inhibited spiking activity of layer 4 NpHR-YFP-expressing PV INs during UP states. (F) Yellow light increased spiking of a layer 4 PN during a thalamus-triggered UP state. (G) Population results showing that yellow light significantly increased spiking of layer 4 PNs during UP states. In B, D, and F, yellow bars represent photostimulation (591 nm, 1 s, 5 mW) and arrows indicate thalamic stimulation. In C, E, and G, data from the same cell are connected by a line. Open symbols represent the mean values for individual cells, and filled symbols represent the mean values across cells. Error bars indicate s.e.m. *** p < 0.001, paired t test.
Figure 7. Inhibition of SOM INs increases firing of layers 2/3 PCs in an active network
(A) Merged confocal image of NpHR-YFP-expressing neurons (green) and SOM-immunopositive neurons (red) in layers 2/3 barrel cortex of an adult SOM-Cre mouse, indicating NpHR expression was confined to SOM INs. Boxed region is expanded to show the overlay (yellow, right) of NpHR-YFP expression (green, middle) and SOM immunostaining (red, left). (B) Yellow light induced a large amplitude hyperpolarization in a layers 2/3 NpHR-YFP-expressing SOM interneuron. (C) Summary plot of membrane potential of layers 2/3 NpHR-YFP expressing SOM INs measured in the absence or presence of yellow light. (D) Yellow light reduced spiking of a layers 2/3 NpHR-YFP-expressing SOM interneuron during thalamus-triggered UP state due to the large hyperpolarization induced by photostimulation. (E) Population results showing that yellow light nearly completely suppressed the spiking activity of layers 2/3 NpHR-YFP-expressing SOM INs during UP states. (F) Yellow light increased spikes of a layer 2/3 PC during a thalamus-triggered UP state. (G) Population results showing that yellow light significantly increased spiking of layers 2/3 PCs during UP states. In B, D, and F, yellow bars represent photostimulation (591 nm, 1 s, 5 mW) and arrows indicate thalamic stimulation. In C, E, and G, data from the same cell are connected by a line. Open symbols represent the mean values for individual cells, and filled symbols represent the mean values across cells. Error bars indicate s.e.m. ** p < 0.01, *** p < 0.001, paired t test.
Similar articles
- Diversity and Connectivity of Layer 5 Somatostatin-Expressing Interneurons in the Mouse Barrel Cortex.
Nigro MJ, Hashikawa-Yamasaki Y, Rudy B. Nigro MJ, et al. J Neurosci. 2018 Feb 14;38(7):1622-1633. doi: 10.1523/JNEUROSCI.2415-17.2017. Epub 2018 Jan 11. J Neurosci. 2018. PMID: 29326172 Free PMC article. - Impaired excitability of somatostatin- and parvalbumin-expressing cortical interneurons in a mouse model of Dravet syndrome.
Tai C, Abe Y, Westenbroek RE, Scheuer T, Catterall WA. Tai C, et al. Proc Natl Acad Sci U S A. 2014 Jul 29;111(30):E3139-48. doi: 10.1073/pnas.1411131111. Epub 2014 Jul 14. Proc Natl Acad Sci U S A. 2014. PMID: 25024183 Free PMC article. - Learning-induced plasticity in the barrel cortex is disrupted by inhibition of layer 4 somatostatin-containing interneurons.
Dobrzanski G, Lukomska A, Zakrzewska R, Posluszny A, Kanigowski D, Urban-Ciecko J, Liguz-Lecznar M, Kossut M. Dobrzanski G, et al. Biochim Biophys Acta Mol Cell Res. 2022 Jan;1869(1):119146. doi: 10.1016/j.bbamcr.2021.119146. Epub 2021 Sep 30. Biochim Biophys Acta Mol Cell Res. 2022. PMID: 34599984 - Somatostatin-Expressing Inhibitory Interneurons in Cortical Circuits.
Yavorska I, Wehr M. Yavorska I, et al. Front Neural Circuits. 2016 Sep 29;10:76. doi: 10.3389/fncir.2016.00076. eCollection 2016. Front Neural Circuits. 2016. PMID: 27746722 Free PMC article. Review. - Diversity and Function of Somatostatin-Expressing Interneurons in the Cerebral Cortex.
Riedemann T. Riedemann T. Int J Mol Sci. 2019 Jun 17;20(12):2952. doi: 10.3390/ijms20122952. Int J Mol Sci. 2019. PMID: 31212931 Free PMC article. Review.
Cited by
- GABA-Synthesizing Enzymes in Calbindin and Calretinin Neurons in Monkey Prefrontal Cortex.
Rocco BR, Sweet RA, Lewis DA, Fish KN. Rocco BR, et al. Cereb Cortex. 2016 May;26(5):2191-2204. doi: 10.1093/cercor/bhv051. Epub 2015 Mar 30. Cereb Cortex. 2016. PMID: 25824535 Free PMC article. - Impact of somatostatin interneurons on interactions between barrels in plasticity induced by whisker deprivation.
Dobrzanski G, Zakrzewska R, Kossut M, Liguz-Lecznar M. Dobrzanski G, et al. Sci Rep. 2022 Oct 26;12(1):17992. doi: 10.1038/s41598-022-22801-0. Sci Rep. 2022. PMID: 36289269 Free PMC article. - Gradient of Parvalbumin- and Somatostatin-Expressing Interneurons Across Cingulate Cortex Is Differentially Linked to Aggression and Sociability in BALB/cJ Mice.
van Heukelum S, Mogavero F, van de Wal MAE, Geers FE, França ASC, Buitelaar JK, Beckmann CF, Glennon JC, Havenith MN. van Heukelum S, et al. Front Psychiatry. 2019 Nov 15;10:809. doi: 10.3389/fpsyt.2019.00809. eCollection 2019. Front Psychiatry. 2019. PMID: 31803076 Free PMC article. - Distribution Patterns of Three Molecularly Defined Classes of GABAergic Neurons Across Columnar Compartments in Mouse Barrel Cortex.
Almási Z, Dávid C, Witte M, Staiger JF. Almási Z, et al. Front Neuroanat. 2019 Apr 30;13:45. doi: 10.3389/fnana.2019.00045. eCollection 2019. Front Neuroanat. 2019. PMID: 31114486 Free PMC article. - Local CRH signaling promotes synaptogenesis and circuit integration of adult-born neurons.
Garcia I, Quast KB, Huang L, Herman AM, Selever J, Deussing JM, Justice NJ, Arenkiel BR. Garcia I, et al. Dev Cell. 2014 Sep 29;30(6):645-59. doi: 10.1016/j.devcel.2014.07.001. Epub 2014 Sep 4. Dev Cell. 2014. PMID: 25199688 Free PMC article.
References
- Agmon A, Connors BW. Thalamocortical responses of mouse somatosensory (barrel) cortex in vitro. Neuroscience. 1991;41:365–379. - PubMed
- Beierlein M, Gibson JR, Connors BW. Two dynamically distinct inhibitory networks in layer 4 of the neocortex. J. Neurophysiol. 2003;90:2987–3000. - PubMed
- Bruno RM, Sakmann B. Cortex is driven by weak but synchronously active thalamocortical synapses. Science. 2006;312:1622–1627. - PubMed
Publication types
MeSH terms
Substances
Grants and funding
- P01 NS074972/NS/NINDS NIH HHS/United States
- NS045217/NS/NINDS NIH HHS/United States
- R01 NS030989/NS/NINDS NIH HHS/United States
- NS30989/NS/NINDS NIH HHS/United States
- R01 NS045217/NS/NINDS NIH HHS/United States
LinkOut - more resources
Full Text Sources
Other Literature Sources
