Loss-of-function mutations in MGME1 impair mtDNA replication and cause multisystemic mitochondrial disease - PubMed (original) (raw)
doi: 10.1038/ng.2501. Epub 2013 Jan 13.
Thomas J Nicholls, Tobias B Haack, Susanne Schöler, Viktoriya Peeva, Katharina Danhauser, Kerstin Hallmann, Gábor Zsurka, Joanna Rorbach, Arcangela Iuso, Thomas Wieland, Monica Sciacco, Dario Ronchi, Giacomo P Comi, Maurizio Moggio, Catarina M Quinzii, Salvatore DiMauro, Sarah E Calvo, Vamsi K Mootha, Thomas Klopstock, Tim M Strom, Thomas Meitinger, Michal Minczuk, Wolfram S Kunz, Holger Prokisch
Affiliations
- PMID: 23313956
- PMCID: PMC3678843
- DOI: 10.1038/ng.2501
Loss-of-function mutations in MGME1 impair mtDNA replication and cause multisystemic mitochondrial disease
Cornelia Kornblum et al. Nat Genet. 2013 Feb.
Abstract
Known disease mechanisms in mitochondrial DNA (mtDNA) maintenance disorders alter either the mitochondrial replication machinery (POLG, POLG2 and C10orf2) or the biosynthesis pathways of deoxyribonucleoside 5'-triphosphates for mtDNA synthesis. However, in many of these disorders, the underlying genetic defect has yet to be discovered. Here, we identify homozygous nonsense and missense mutations in the orphan gene C20orf72 in three families with a mitochondrial syndrome characterized by external ophthalmoplegia, emaciation and respiratory failure. Muscle biopsies showed mtDNA depletion and multiple mtDNA deletions. C20orf72, hereafter MGME1 (mitochondrial genome maintenance exonuclease 1), encodes a mitochondrial RecB-type exonuclease belonging to the PD-(D/E)XK nuclease superfamily. We show that MGME1 cleaves single-stranded DNA and processes DNA flap substrates. Fibroblasts from affected individuals do not repopulate after chemically induced mtDNA depletion. They also accumulate intermediates of stalled replication and show increased levels of 7S DNA, as do MGME1-depleted cells. Thus, we show that MGME1-mediated mtDNA processing is essential for mitochondrial genome maintenance.
Figures
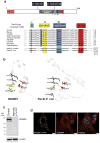
Figure 1. Protein sequence, domain architecture, mutations and subcellular localization of MGME1
(a) Top: Domain architecture of MGME1 indicating the mutations indentified in the patients. The key motifs of the PD-(D/E)XK nuclease superfamily are indicated in Roman numerals and the sequence details of the motifs characteristic for the RecB-type subgroup are shown as color boxes below the schematic structure (“h” indicates a hydrophobic residue). “MTS” indicates the predicted mitochondrial targeting signal. Bottom: Alignment of protein sequences of the orthologues of MGME1 and RecB-type nucleases. The c.698A>G, p.Tyr233Cys mutation is highlighted in black. Colons denote chemical similarity between the sequences, asterisks indicate identical residues. GenBank accession numbers of sequences used in the alignment are as follows: Human, NP_443097; Mouse, NP_083260; Chicken, XP_415017; Green anole lizard, XP_003219931, Xenopus, NP_001120532; Zebrafish, NP_0001008640; Lancelet, XP_002610511; Sea squirt, XP_002119404; Cyanobacteria, YP_002377694; AddA Bacillus subtilis, YP_004207075; RecB Escherichia coli, EGB85545. (b) The predicted active site structural motif of MGME1 based on the known crystal structure of the homologous RecB-type nucleases (left). Structure prediction was made using the 3D-Jury algorithm and modelled using the MODELLER software. The active site structure of E.coli RecB is provided for comparison (right). (c) Western blot showing protein level of MGME1 in P1976 fibroblasts (FB1976) and control fibroblasts. β-actin was used as a loading control. (d) Cellular localization of the GFP-tagged variant of MGME1 (green) in human fibroblasts. mtSSBP was used as a mitochondrial marker (red). Nuclei were stained with DAPI (blue). Co-localization of the green and red signal appears yellow on digitally overlaid images (overlay). Scale bars indicate 10μm.
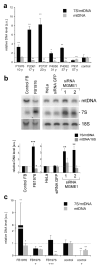
Figure 2. Loss of MGME1 leads to mtDNA depletion and elevated levels of 7S DNA
(a) Relative mtDNA copy numbers (gray bars) and 7S/mtDNA ratios (black bars) in skeletal muscle from patients with MGME1 mutations. The data are shown as averages ± standard deviations (SD) of three independent qPCR determinations and normalized to the corresponding control values. The control values are averages ± SD from eleven skeletal muscle biopsies samples, age range 18 – 33 years, mtDNA copy number range 8,146–11,416 molecules per nucleus. * P<0.05, ** P<0.01; two-tailed Student’s t- test. (b) Total DNA from control or patient (FB1976) fibroblasts (cell passage 15–21) and from untransfected HeLa cells (HeLa), cells transfected with siRNA to GFP or siRNA to MGME1 for 6 days analyzed by 1D Southern blotting with a radioactive probe specific for the non-coding region (NCR) in human mtDNA (mtDNA region: 14,258–4,121) followed by a probe specific for the 18S rDNA. The values of the relative DNA level (black bars, 7S DNA/mtDNA; grey bars, mtDNA/18S rDNA) obtained by quantifying PhosphorImager scans of Southern blots using ImageQuant software and normalized for the values obtained for control fibroblasts or untransfected HeLa cells. * P<0.05, ** P<0.01, *** P<0.001; two-tailed Student’s t- test; n=3, error bars=1 SD. Age of biopsy indicated. (c) Relative mtDNA copy numbers (grey bars) and 7S/mtDNA ratios (black bars) in fibroblasts of a patient with a _MGME1_-null mutation (P1976, cell passage 6–10) and a control. When indicated, the fibroblasts were transduced with low (“+”) or high (“+++”) titer of a lentiviral MGME1 construct. * P<0.05, ** P<0.01; two-tailed Student’s t- test; n=3, error bars=1 SD.
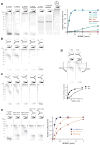
Figure 3. Characterization of the enzymatic activity of MGME1
(a) DNase activity of MGME1 and the preference towards ssDNA vs. dsDNA. 1 pmol of radioactively labeled substrates (asterisks indicate the label) was incubated for 30 min with increasing concentrations (0.125, 0.25, 0.5, 1, 2, 4 pmoles) of purified MGME1 or 4 pmols of the p.Lys253Ala mutant (K253A). Reaction products were subjected to denaturing PAGE and autoradiography; were quantified, and the intensity was plotted against the enzyme concentration (right). (b) and (c) MGME1 activity on 5′ displaced (b) and 3′ displaced (c) splayed arm and flap-like DNA structures. Reaction conditions were as per (a). Asterisks indicate positions of radioactive label. (d) Comparison of the MGME1 processing efficiency on the 5′ displaced (5′-flap) and 3′ displaced (3′-flap) flap-like DNA substrates with mapping of the radioactive products. Signal intensities of processed and partially processed reaction product were quantified and plotted as in a. (e) MGME1 activity on RNA-DNA chimeric substrates that resemble Okazaki fragments. Increasing concentrations of purified MGME1 were incubated with a 5′ radioactively end-labelled RNA-DNA substrates as schematically indicated in the reaction conditions as described in (a). Numbers on the top indicate oligonucleotide lengths. SA, splayed-arm structure. Quantification of the reactions upon PAGE and autoradiography is shown to the right.
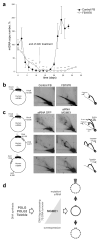
Figure 4. Perturbed mitochondrial replication in patient fibroblasts and MGME1-depleted cells
(a) MtDNA copy number during induced depletion and repopulation of human control fibroblasts (filled circles) and MGME1-null fibroblasts (FB1976 open circles). MtDNA copy numbers were determined by qPCR. Depletion of mtDNA was achieved by addition of 20 μM ddC to the culture medium for 12 days. MtDNA copy numbers were determined by qPCR using the mitochondrial primers MT3922F25 and MT4036R26. Data points for FB1976 represent the mean of three determinations ± SD values. The data for control fibroblasts are averages ± SD of mtDNA depletion-repopulation experiments with two separate cell lines. * P<0.05, ** P<0.01; two-tailed Student’s t- test. (b) and (c) Mitochondrial DNA replication in MGME1-null fibroblasts and MGME1-depleted cells. Total DNA from control or FB1976 fibroblasts (b) and HeLa cells transfected with siRNA to GFP or siRNA to MGME1 for 6 days (c) was subjected to two-dimensional neutral–neutral agarose-gel electrophoresis (2DNAGE) followed by Southern blotting. Restriction enzymes and probes used (grey bars) are indicated in the far left column of the figure. The nucleotide positions of the probes were as follows: _Hinc_II: nt 16,341–151, _Dra_I: nt 13,202–13,800 and _Acc_I: nt 3,587–4,161. Black bar indicates the NCR; OH, origin of H-strand replication. The interpretation based on, is provided in the far right column of the figure. 1n, – non-replicating fragment. (d) Scheme showing the proposed involvement of MGME1 in mtDNA maintenance. Mutation or siRNA knockdown of MGME1 results in accumulation of replication intermediates followed by mtDNA depletion and 7S DNA accumulation (right black arrow up). In contrast, overexpression of MGME1 causes promiscuous degradation of mtDNA (including 7S DNA) resulting in mtDNA depletion (right black arrow down).
Similar articles
- Human mitochondrial DNA replication machinery and disease.
Young MJ, Copeland WC. Young MJ, et al. Curr Opin Genet Dev. 2016 Jun;38:52-62. doi: 10.1016/j.gde.2016.03.005. Epub 2016 Apr 9. Curr Opin Genet Dev. 2016. PMID: 27065468 Free PMC article. Review. - Linear mtDNA fragments and unusual mtDNA rearrangements associated with pathological deficiency of MGME1 exonuclease.
Nicholls TJ, Zsurka G, Peeva V, Schöler S, Szczesny RJ, Cysewski D, Reyes A, Kornblum C, Sciacco M, Moggio M, Dziembowski A, Kunz WS, Minczuk M. Nicholls TJ, et al. Hum Mol Genet. 2014 Dec 1;23(23):6147-62. doi: 10.1093/hmg/ddu336. Epub 2014 Jun 30. Hum Mol Genet. 2014. PMID: 24986917 Free PMC article. - Mice lacking the mitochondrial exonuclease MGME1 accumulate mtDNA deletions without developing progeria.
Matic S, Jiang M, Nicholls TJ, Uhler JP, Dirksen-Schwanenland C, Polosa PL, Simard ML, Li X, Atanassov I, Rackham O, Filipovska A, Stewart JB, Falkenberg M, Larsson NG, Milenkovic D. Matic S, et al. Nat Commun. 2018 Mar 23;9(1):1202. doi: 10.1038/s41467-018-03552-x. Nat Commun. 2018. PMID: 29572490 Free PMC article. - The 5'-phosphate enhances the DNA-binding and exonuclease activities of human mitochondrial genome maintenance exonuclease 1 (MGME1).
Urrutia KM, Xu W, Zhao L. Urrutia KM, et al. J Biol Chem. 2022 Sep;298(9):102306. doi: 10.1016/j.jbc.2022.102306. Epub 2022 Aug 5. J Biol Chem. 2022. PMID: 35934053 Free PMC article. - Defects of mitochondrial DNA replication.
Copeland WC. Copeland WC. J Child Neurol. 2014 Sep;29(9):1216-24. doi: 10.1177/0883073814537380. Epub 2014 Jun 30. J Child Neurol. 2014. PMID: 24985751 Free PMC article. Review.
Cited by
- The clinical maze of mitochondrial neurology.
DiMauro S, Schon EA, Carelli V, Hirano M. DiMauro S, et al. Nat Rev Neurol. 2013 Aug;9(8):429-44. doi: 10.1038/nrneurol.2013.126. Epub 2013 Jul 9. Nat Rev Neurol. 2013. PMID: 23835535 Free PMC article. Review. - Human mitochondrial DNA replication machinery and disease.
Young MJ, Copeland WC. Young MJ, et al. Curr Opin Genet Dev. 2016 Jun;38:52-62. doi: 10.1016/j.gde.2016.03.005. Epub 2016 Apr 9. Curr Opin Genet Dev. 2016. PMID: 27065468 Free PMC article. Review. - Primer retention owing to the absence of RNase H1 is catastrophic for mitochondrial DNA replication.
Holmes JB, Akman G, Wood SR, Sakhuja K, Cerritelli SM, Moss C, Bowmaker MR, Jacobs HT, Crouch RJ, Holt IJ. Holmes JB, et al. Proc Natl Acad Sci U S A. 2015 Jul 28;112(30):9334-9. doi: 10.1073/pnas.1503653112. Epub 2015 Jul 10. Proc Natl Acad Sci U S A. 2015. PMID: 26162680 Free PMC article. - Changes to the mtDNA copy number during yeast culture growth.
Galeota-Sprung B, Fernandez A, Sniegowski P. Galeota-Sprung B, et al. R Soc Open Sci. 2022 Jul 6;9(7):211842. doi: 10.1098/rsos.211842. eCollection 2022 Jul. R Soc Open Sci. 2022. PMID: 35814911 Free PMC article. - Nuclear mitochondria-related genes-based molecular classification and prognostic signature reveal immune landscape, somatic mutation, and prognosis for glioma.
Liu C, Zhang N, Xu Z, Wang X, Yang Y, Bu J, Cao H, Xiao J, Xie Y. Liu C, et al. Heliyon. 2023 Sep 5;9(9):e19856. doi: 10.1016/j.heliyon.2023.e19856. eCollection 2023 Sep. Heliyon. 2023. PMID: 37809472 Free PMC article.
References
- Van Goethem G, et al. Mutation of POLG is associated with progressive external ophthalmoplegia characterized by mtDNA deletions. Nat Genet. 2001;28:211–212. - PubMed
- Spelbrink JN, et al. Human mitochondrial DNA deletions associated with mutations in the gene encoding Twinkle, a phage T7 gene 4-like protein localized in mitochondria. Nat Genet. 2001;28:223–231. - PubMed
- Nishino I, Spinazzola A, Hirano M. Thymidine phosphorylase gene mutations in MNGIE, a human mitochondrial disorder. Science. 1999;283:689–692. - PubMed
- Kaukonen J, et al. Role of adenine nucleotide translocator 1 in mtDNA maintenance. Science. 2000;289:782–785. - PubMed
Publication types
MeSH terms
Substances
Grants and funding
- C.37/TI_/Telethon/Italy
- R01 GM097136/GM/NIGMS NIH HHS/United States
- MC_U105697135/MRC_/Medical Research Council/United Kingdom
- C.46/TI_/Telethon/Italy
- GTB07001/TI_/Telethon/Italy
- K23 HD065871/HD/NICHD NIH HHS/United States
- GM077465/GM/NIGMS NIH HHS/United States
- R01 GM077465/GM/NIGMS NIH HHS/United States
- GTF01001/TI_/Telethon/Italy
- GTF02008/TI_/Telethon/Italy
- GM097136/GM/NIGMS NIH HHS/United States
- GUP09004/TI_/Telethon/Italy
LinkOut - more resources
Full Text Sources
Other Literature Sources
Medical
Molecular Biology Databases


