Twist1 induces CCL2 and recruits macrophages to promote angiogenesis - PubMed (original) (raw)
Twist1 induces CCL2 and recruits macrophages to promote angiogenesis
Janine M Low-Marchelli et al. Cancer Res. 2013.
Abstract
The transcription factor Twist1 induces epithelial-mesenchymal transition and extracellular matrix degradation to promote tumor metastasis. Although Twist1 also plays a role in embryonic vascular development and tumor angiogenesis, the molecular mechanisms that underlie these processes are not as well understood. Here, we report a novel function for Twist1 in modifying the tumor microenvironment to promote progression. We found that expression of Twist1 in human mammary epithelial cells potently promoted angiogenesis. Surprisingly, Twist1 expression did not increase the secretion of the common proangiogenic factors VEGF and basic fibroblast growth factor but rather induced expression of the macrophage chemoattractant CCL2. Attenuation of endogenous Twist1 in vivo blocked macrophage recruitment and angiogenesis, whereas exogenous CCL2 rescued the ability of tumor cells lacking Twist1 to attract macrophages and promote angiogenesis. Macrophage recruitment also was essential for the ability of Twist1-expressing cells to elicit a strong angiogenic response. Together, our findings show that how Twist1 recruits stromal macrophages through CCL2 induction to promote angiogenesis and tumor progression. As Twist1 expression has been associated with poor survival in many human cancers, this finding suggests that anti-CCL2 therapy may offer a rational strategy to treat Twist1-positive metastatic cancers.
Conflict of interest statement
Disclosure of Potential Conflict of interest:
No potential conflict of interest is disclosed.
Figures
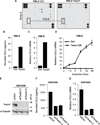
Figure 1. Twist1 promotes angiogenesis in a chicken chorioallantoic membrane angiogenesis assay
A) Lysates from HMLE-Ctrl and HMLE-Twist1 cells were analyzed by SDS-PAGE and probed for Twist1 and β-actin (full-length blot, Supplementary Fig. S1). B) Cells were suspended in collagen and resulting onplants were grafted onto the CAMs of 10-day embryos. Live angiogenic scoring was performed 72 hrs later using a dissection microscope. Shown are representative images of onplants with new vessel growth. C) Angiogenesis quantification for one representative experiment. Angiogenic index is the percentage of vessel positive grids in each onplant. Each data point represents the angiogenic index in one of approximately 25 onplants distributed across 4–6 embryos per cell type, * p<0.05 by Student’s T-test. D) Quantification of average angiogenesis for 11 independent experiments. Error bars are SEM, *p<0.05 by Student’s T-test.
Figure 2. Twist1 is necessary and sufficient to induce CCL2 expression
A) Analysis of secreted cytokines by HMLE-Ctrl and HMLE-Twist1 cells by cytokine expression array. Conditioned media were collected for 48 hr and incubated with array membranes to measure 174 human cytokines. CCL2 levels are highlighted on one set of membranes. B) Levels of CCL2 protein were measured by ELISA in conditioned media from indicated HMLE cells. C) Levels of CCL2 mRNA were measured by QPCR analysis inindicated HMLE cells. D) Levels of CCL2 mRNA were measured by QPCR analysis in HMLE-Twist1-ER cells (solid line) or HMLE cells (dashed line) treated with 20 nM 4-hydroxy-tamoxifen. E) Lysates from 168FARN cells expressing two shRNAs against Twist1 or a control shRNA were analyzed by SDS-PAGE and probed for Twist1 and α-Tubulin (full-length blots Supplementary Fig. S2D). F) The levels of CCL2 were measured by ELISA in conditioned media from indicated 168FARN cells. G) Levels of CCL2 mRNA as measured by QPCR analysis in indicated 168FARN cells.
Figure 3. CCL2 mediates Twist1-induced angiogenesis in the CAM assay
A) QPCR analysis of CCL2 mRNA levels in HMLE-Ctrl and HMLE-Twist1 cells with indicated shRNAs. B) The levels of CCL2 protein were measured by ELISA in conditioned media from indicated HMLE cells. C) Lysates from indicated HMLE cells were analyzed by SDS-PAGE and probed for Twist1, E-cadherin, fibronectin, and α-tubulin (full-length blots, SFig.3A). D) Quantification of angiogenesis from three independent CAM angiogenesis experiments. For each experiment, 5–8 onplants were evenly distributed across 4–6 ten-day-old embryos per cell type tested, *p<0.05 versus HMLE-Ctrl, #p<0.05 versus HMLE-Twist1 shCtrl by ANOVA followed by Tukey Test.
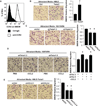
Figure 4. Twist1 expression in mammary epithelial cells promotes macrophage attraction in a CCL2-dependent manner
A) Cell surface expression of CCR2 on isolated mouse BMDM as measured by flow cytometry analysis using anti-CCR2 (open) versus Control IgG (shaded) antibody staining. B) BMDM were subjected to Boyden Chamber migration assays toward conditioned media from HMLE-Ctrl or HMLE-Twist1 cells. Representative images of migrated macrophages stained with crystal violet (top) and quantification of relative migration (bottom) for one representative experiment, *p<0.05 by Student’s T-test. C) Macrophage migration toward conditioned media from 168FARN cells with indicated shRNAs for one representative experiment, *p<0.05 versus shCtrl by ANOVA followed by Tukey Test. D) Macrophage migration toward conditioned media from 168FARN cells with shRNAs against Twist1, coincubated with either PBS or rCCL2 (10 ng/mL) for one representative experiment, *p<0.05 by Student’s T-test. E) Macrophage migration toward conditioned media from HMLE-Twist1 cells expressing indicated shRNAs for one representative experiment, *p<0.05 versus shCtrl by ANOVA followed by Tukey Test.
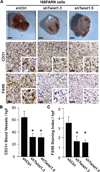
Figure 5. Twist1 expression promotes angiogenesis and macrophage infiltration in the Matrigel plug assay
A) A mixture of Matrigel and 168FARN mouse mammary tumor cells was subcutaneously injected into 4–5 mice/group. Resulting plugs were harvested 5 days later and processed for immunohistochemical staining. Top row, macroscopic images of plugs; middle row, images of tissue sections stained for blood vessel marker CD31(brown); bottom row, images of tissue sections stained for mature macrophage marker F4/80 (brown). Nuclei were stained with hematoxylin (blue). Insets show magnification for staining detail, scale bar = 2 mm. B and C) Quantification of stains in (A), 5 random high-powered fields per section were counted for number of CD31 stained vessels or were scored for F4/80 staining intensity and distribution; 7–10 plugs/group and 1–2 sections/plug were analyzed. Scale bar = 50 µm, error bars are SEM, *p<0.05 versus shCtrl by ANOVA followed by Tukey Test.
Figure 6. CCL2 and macrophage recruitment are essential for Twist1-induced angiogenesis
A) A mixture of Matrigel and 168FARN cells was subcutaneously injected mice either previously depleted of macrophages by clodronate-encapsulated liposomes (9 mice) or treated with Control liposomes (6 mice). Resulting plugs were harvested 5 days later and processed for immunohistochemical staining. Top row, macroscopic images of plugs; middle row, images of tissue sections stained for blood vessel marker CD31(brown); bottom row, images of tissue sections stained for mature macrophage marker F4/80 (brown). Nuclei were stained with hematoxylin (blue). Scale bar = 2 mm. B and C) Quantification of stains in (A), 5 random high-powered fields per section were counted for number of CD31 stained vessels or were scored for F4/80 staining intensity and distribution; 10–15 plugs/group and 1–2 sections/plug were analyzed. Scale bar = 50 µm, error bars are SEM. *p<0.05 by Student’s T-test. D) Matrigel plug assays were performed using 168FARN mouse mammary tumor cells and supplemented with recombinant CCL2 (10 ng/mL final concentration) or PBS using at least 3 mice/group. Scale bar = 2 mm. E and F) Quantification of stains in (D), with 6–8 plugs/group and 1–2 sections/plug analyzed. Scale bar = 50 µm, error bars are SEM, *p<0.05 by Student’s T-test.
Figure 7. Proposed model for Twist1-induced angiogenesis through CCL2 induction and macrophage recruitment
Carcinoma cells expressing Twist1 upregulate CCL2 transcript leading to increased CCL2 protein in the tumor microenvironment. The CCL2 gradient attracts macrophages, which then promote angiogenesis.
Similar articles
- MYC and Twist1 cooperate to drive metastasis by eliciting crosstalk between cancer and innate immunity.
Dhanasekaran R, Baylot V, Kim M, Kuruvilla S, Bellovin DI, Adeniji N, Rajan Kd A, Lai I, Gabay M, Tong L, Krishnan M, Park J, Hu T, Barbhuiya MA, Gentles AJ, Kannan K, Tran PT, Felsher DW. Dhanasekaran R, et al. Elife. 2020 Jan 14;9:e50731. doi: 10.7554/eLife.50731. Elife. 2020. PMID: 31933479 Free PMC article. - Krüppel like factor 6 splice variant 1 (KLF6-SV1) overexpression recruits macrophages to participate in lung cancer metastasis by up-regulating TWIST1.
Wang J, Wang X, Wang Y, Li S, Wang X. Wang J, et al. Cancer Biol Ther. 2019;20(5):680-691. doi: 10.1080/15384047.2018.1550570. Epub 2018 Dec 27. Cancer Biol Ther. 2019. PMID: 30590988 Free PMC article. - CXCL11 mediates TWIST1-induced angiogenesis in epithelial ovarian cancer.
Koo YJ, Kim TJ, Min KJ, So KA, Jung US, Hong JH. Koo YJ, et al. Tumour Biol. 2017 May;39(5):1010428317706226. doi: 10.1177/1010428317706226. Tumour Biol. 2017. PMID: 28488542 - Normal and disease-related biological functions of Twist1 and underlying molecular mechanisms.
Qin Q, Xu Y, He T, Qin C, Xu J. Qin Q, et al. Cell Res. 2012 Jan;22(1):90-106. doi: 10.1038/cr.2011.144. Epub 2011 Aug 30. Cell Res. 2012. PMID: 21876555 Free PMC article. Review. - The role of TWIST1 in epithelial-mesenchymal transition and cancers.
Zhu QQ, Ma C, Wang Q, Song Y, Lv T. Zhu QQ, et al. Tumour Biol. 2016 Jan;37(1):185-97. doi: 10.1007/s13277-015-4450-7. Epub 2015 Nov 24. Tumour Biol. 2016. PMID: 26602382 Review.
Cited by
- Targeting cytokine and chemokine signaling pathways for cancer therapy.
Yi M, Li T, Niu M, Zhang H, Wu Y, Wu K, Dai Z. Yi M, et al. Signal Transduct Target Ther. 2024 Jul 22;9(1):176. doi: 10.1038/s41392-024-01868-3. Signal Transduct Target Ther. 2024. PMID: 39034318 Free PMC article. Review. - Dual effect of vitamin D3 on breast cancer-associated fibroblasts.
Łabędź N, Anisiewicz A, Stachowicz-Suhs M, Banach J, Kłopotowska D, Maciejczyk A, Gazińska P, Piotrowska A, Dzięgiel P, Matkowski R, Wietrzyk J. Łabędź N, et al. BMC Cancer. 2024 Feb 15;24(1):209. doi: 10.1186/s12885-024-11961-z. BMC Cancer. 2024. PMID: 38360633 Free PMC article. - Chemokines and Chemokine Receptors: Orchestrating Tumor Metastasization.
Marcuzzi E, Angioni R, Molon B, Calì B. Marcuzzi E, et al. Int J Mol Sci. 2018 Dec 27;20(1):96. doi: 10.3390/ijms20010096. Int J Mol Sci. 2018. PMID: 30591657 Free PMC article. Review. - Kindlin-3 enhances breast cancer progression and metastasis by activating Twist-mediated angiogenesis.
Sossey-Alaoui K, Pluskota E, Davuluri G, Bialkowska K, Das M, Szpak D, Lindner DJ, Downs-Kelly E, Thompson CL, Plow EF. Sossey-Alaoui K, et al. FASEB J. 2014 May;28(5):2260-71. doi: 10.1096/fj.13-244004. Epub 2014 Jan 27. FASEB J. 2014. PMID: 24469992 Free PMC article. - A vascularized breast cancer spheroid platform for the ranked evaluation of tumor microenvironment-targeted drugs by light sheet fluorescence microscopy.
Ascheid D, Baumann M, Pinnecker J, Friedrich M, Szi-Marton D, Medved C, Bundalo M, Ortmann V, Öztürk A, Nandigama R, Hemmen K, Ergün S, Zernecke A, Hirth M, Heinze KG, Henke E. Ascheid D, et al. Nat Commun. 2024 Apr 27;15(1):3599. doi: 10.1038/s41467-024-48010-z. Nat Commun. 2024. PMID: 38678014 Free PMC article.
References
- Martin TA, Goyal A, Watkins G, Jiang WG. Expression of the transcription factors snail, slug, and twist and their clinical significance in human breast cancer. Ann Surg Oncol. 2005;12:488–496. - PubMed
- Xie F, Li K, Ouyang X. Twist, an independent prognostic marker for predicting distant metastasis and survival rates of esophageal squamous cell carcinoma patients. Clin Exp Metastasis. 2009;26:1025–1032. - PubMed
- Yang J, Mani SA, Donaher JL, Ramaswamy S, Itzykson RA, Come C, et al. Twist, a master regulator of morphogenesis, plays an essential role in tumor metastasis. Cell. 2004;117:927–939. - PubMed
Publication types
MeSH terms
Substances
Grants and funding
- R01 CA105412/CA/NCI NIH HHS/United States
- K12 GM068524/GM/NIGMS NIH HHS/United States
- R01 CA157792/CA/NCI NIH HHS/United States
- T32 GM08666/GM/NIGMS NIH HHS/United States
- T32 GM008666/GM/NIGMS NIH HHS/United States
- R01 CA129484/CA/NCI NIH HHS/United States
- DP2 OD002420-01/OD/NIH HHS/United States
- DP2 OD002420/OD/NIH HHS/United States
LinkOut - more resources
Full Text Sources
Other Literature Sources
Medical
Research Materials


