A complete mass-spectrometric map of the yeast proteome applied to quantitative trait analysis - PubMed (original) (raw)
. 2013 Feb 14;494(7436):266-70.
doi: 10.1038/nature11835. Epub 2013 Jan 20.
Mathieu Clément-Ziza, Henry Lam, David S Campbell, Alexander Schmidt, Eric W Deutsch, Hannes Röst, Zhi Sun, Oliver Rinner, Lukas Reiter, Qin Shen, Jacob J Michaelson, Andreas Frei, Simon Alberti, Ulrike Kusebauch, Bernd Wollscheid, Robert L Moritz, Andreas Beyer, Ruedi Aebersold
Affiliations
- PMID: 23334424
- PMCID: PMC3951219
- DOI: 10.1038/nature11835
A complete mass-spectrometric map of the yeast proteome applied to quantitative trait analysis
Paola Picotti et al. Nature. 2013.
Abstract
Experience from different fields of life sciences suggests that accessible, complete reference maps of the components of the system under study are highly beneficial research tools. Examples of such maps include libraries of the spectroscopic properties of molecules, or databases of drug structures in analytical or forensic chemistry. Such maps, and methods to navigate them, constitute reliable assays to probe any sample for the presence and amount of molecules contained in the map. So far, attempts to generate such maps for any proteome have failed to reach complete proteome coverage. Here we use a strategy based on high-throughput peptide synthesis and mass spectrometry to generate an almost complete reference map (97% of the genome-predicted proteins) of the Saccharomyces cerevisiae proteome. We generated two versions of this mass-spectrometric map, one supporting discovery-driven (shotgun) and the other supporting hypothesis-driven (targeted) proteomic measurements. Together, the two versions of the map constitute a complete set of proteomic assays to support most studies performed with contemporary proteomic technologies. To show the utility of the maps, we applied them to a protein quantitative trait locus (QTL) analysis, which requires precise measurement of the same set of peptides over a large number of samples. Protein measurements over 78 S. cerevisiae strains revealed a complex relationship between independent genetic loci, influencing the levels of related proteins. Our results suggest that selective pressure favours the acquisition of sets of polymorphisms that adapt protein levels but also maintain the stoichiometry of functionally related pathway members.
Figures
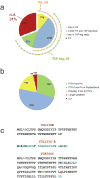
Figure 1. Yeast proteome statistics and peptide selection criteria
(a) Detectability of the yeast proteome by large-scale proteomic and antibody-based approaches, as derived from the PeptideAtlas database and from Ghaemmaghammi et al (5). (b) Selection of PTPs for the yeast proteome. For each protein we selected up to eight most frequently observed PTPs in the PeptideAtlas (PA) that were also conforming to defined length constraints (see Methods). For proteins with zero to five PTPs in PA which had been detected via the antibody-based approach[5] we selected up to five additional PTPs predicted with PeptideSieve[26]. For proteins undetected by both proteomic and antibody-based methods, we predicted five PTPs, forcing the selection of at least two of these to a pI below 4.5, where available. For the remaining unmatched ORFs we relaxed the peptide length constraints (see Methods), and repeated the previous steps. The pie chart represents proteins associated to all S. cerevisiae ORFs. Proteins for which peptides were selected based only on PA evidence, (green), on PA evidence or PeptideSieve prediction (blue); on PeptideSieve prediction, including two peptides with pI<4.5; Proteins for which longer peptides were allowed (pink); proteins not covered by our peptide selection criteria (red). (c) Example of protein sequences that lack suitable proteotypic peptides. Trypsin cleavage sites are indicated in blue; RP/KP bonds, which prevent trypsin cleavage, are in green.
Figure 2. Generation of a reference mass spectrometric map for the yeast proteome
The schema shows the sequential steps of map generation: peptides were selected based on the known ORFeome and the criteria listed in the text; peptides were synthesized on a small scale using the SPOT-synthesis technology; the peptide library was analyzed on a QQQ MS and an ion trap-type mass spectrometer to generate the corresponding consensus spectral libraries; existing, quality filtered datasets were added to the synthetic spectral libraries; the QQQ library was used to extract the best coordinates for SRM measurements of yeast proteins; the consensus ion trap library can be used for spectral searches of any LC-MS/MS dataset from S. cerevisiae.
Figure 3. Composition and usage of the spectral libraries
(a) Number of peptides per protein in the SRM assay (green) or ion trap (yellow) library. The percentage is relative to the total of 6,607 theoretical S. cerevisiae proteins. (b) Hydrophobicity distribution for all selected peptides (green) and for those that could not be detected with our QQQ-workflow (yellow). Hydrophobicity is expressed as SSRCalc[64] score bins. % values are relative to the total number of peptides synthesized in each bin. (c) Number of protein identifications from an unfractionated whole yeast digest by various methods, as a function of decoy-estimated protein false discovery rates. The instrument used was an Orbitrap Velos (Thermo Scientific). DDA, conventional data-dependent acquisition; IL, inclusion list-based acquisition; SeqS, sequence database searching against the yeast theoretical proteome, performed with the engine X!Tandem[36]; SpS, spectral searching against the IT library, with the tool SpectraST[62]. (d) Minimal number of transitions needed to uniquely identify precursor ions in the QQQ library. A cumulative plot of the minimal number of transitions forming a unique ion signature (UIS) is shown for all the precursors in the QQQ SRM library. Transitions were selected with decreasing intensity from the SRMAtlas and uniqueness for a set of transitions was established if no other precursor within a Q1/Q3 window ± 0.7 m/z (and SSRCalc-predicted elution time window, for time-scheduled acquisition) produced transitions that contained all of the query transitions. The analysis is shown for two different backgrounds: all yeast peptides potentially detectable by MS, as derived from the yeast PA (purple) and all theoretical tryptic peptides in the yeast proteome (green). RT/no RT indicate whether time-scheduled SRM acquisition is considered.
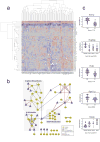
Figure 4. Quantitative trait analysis from the targeted proteomic dataset
(a) Two-way cluster analysis of summarized protein abundances measured by SRM in 82 samples (78 strains) of the RMxBY cross. Columns are clustered according to the samples, and rows according to the proteomic traits. Abundance levels are color coded in a blue-red gradient, red corresponding to high abundance; white indicates missing data. The completeness of the dataset reaches 99.50% even though the summarization procedure was conservative and generated additional missing values. (b) Network representation of protein abundance QTL for the 48 targeted proteins. Metabolic interactions were manually reconstructed from BioCyc (
). Epistatic pQTL (red edges) always connect 2 loci that are in espistasis with respect to a protein abundance trait. (c) Abundances of the proteins of the B1B2 protein module in the parental strains and segregants. For each protein, abundances are shown for groups of strains separated according to their genotype at the respective pQTL. A pair of interacting loci was linked to the variations of Hsp60p. The epistatic interaction is clearly visible when the RM allele is inherited at both loci. In contrast, the effects of the two loci linked to Bat2p are additive. Interestingly, the directionality of regulation is shared by all components of the module but Bat2p (over expression when the RM alleles are inherited). Bat1p and Bat2p are paralogs catalyzing the same metabolic reaction in opposite directions (see Supplementary Discussion).
Comment in
- Mass spectrometry mapmaking.
Doerr A. Doerr A. Nat Methods. 2013 Mar;10(3):192. doi: 10.1038/nmeth.2392. Nat Methods. 2013. PMID: 23570042 No abstract available.
Similar articles
- Reproducibility of combinatorial peptide ligand libraries for proteome capture evaluated by selected reaction monitoring.
Di Girolamo F, Righetti PG, Soste M, Feng Y, Picotti P. Di Girolamo F, et al. J Proteomics. 2013 Aug 26;89:215-26. doi: 10.1016/j.jprot.2013.05.037. Epub 2013 Jun 7. J Proteomics. 2013. PMID: 23747450 - Yeast proteome map (last update).
Perrot M, Moes S, Massoni A, Jenoe P, Boucherie H. Perrot M, et al. Proteomics. 2009 Oct;9(20):4669-73. doi: 10.1002/pmic.200900273. Proteomics. 2009. PMID: 19743426 - Libraries of specific assays covering whole proteomes: from yeast to man.
Anderson NL. Anderson NL. Clin Chem. 2010 Oct;56(10):1521-2. doi: 10.1373/clinchem.2010.147900. Epub 2010 Aug 6. Clin Chem. 2010. PMID: 20693309 No abstract available. - Mass-Spectrometry-Based Near-Complete Draft of the Saccharomyces cerevisiae Proteome.
Gao Y, Ping L, Duong D, Zhang C, Dammer EB, Li Y, Chen P, Chang L, Gao H, Wu J, Xu P. Gao Y, et al. J Proteome Res. 2021 Feb 5;20(2):1328-1340. doi: 10.1021/acs.jproteome.0c00721. Epub 2021 Jan 14. J Proteome Res. 2021. PMID: 33443437 Review. - The proteome of baker's yeast mitochondria.
Gonczarowska-Jorge H, Zahedi RP, Sickmann A. Gonczarowska-Jorge H, et al. Mitochondrion. 2017 Mar;33:15-21. doi: 10.1016/j.mito.2016.08.007. Epub 2016 Aug 14. Mitochondrion. 2017. PMID: 27535110 Review.
Cited by
- Complex-centric proteome profiling by SEC-SWATH-MS for the parallel detection of hundreds of protein complexes.
Bludau I, Heusel M, Frank M, Rosenberger G, Hafen R, Banaei-Esfahani A, van Drogen A, Collins BC, Gstaiger M, Aebersold R. Bludau I, et al. Nat Protoc. 2020 Aug;15(8):2341-2386. doi: 10.1038/s41596-020-0332-6. Epub 2020 Jul 20. Nat Protoc. 2020. PMID: 32690956 - Genomics meets proteomics: identifying the culprits in disease.
Stunnenberg HG, Hubner NC. Stunnenberg HG, et al. Hum Genet. 2014 Jun;133(6):689-700. doi: 10.1007/s00439-013-1376-2. Epub 2013 Oct 18. Hum Genet. 2014. PMID: 24135908 Free PMC article. Review. - Peptide barcoding for one-pot evaluation of sequence-function relationships of nanobodies.
Matsuzaki Y, Aoki W, Miyazaki T, Aburaya S, Ohtani Y, Kajiwara K, Koike N, Minakuchi H, Miura N, Kadonosono T, Ueda M. Matsuzaki Y, et al. Sci Rep. 2021 Nov 2;11(1):21516. doi: 10.1038/s41598-021-01019-6. Sci Rep. 2021. PMID: 34728738 Free PMC article. - Demonstrating the feasibility of large-scale development of standardized assays to quantify human proteins.
Kennedy JJ, Abbatiello SE, Kim K, Yan P, Whiteaker JR, Lin C, Kim JS, Zhang Y, Wang X, Ivey RG, Zhao L, Min H, Lee Y, Yu MH, Yang EG, Lee C, Wang P, Rodriguez H, Kim Y, Carr SA, Paulovich AG. Kennedy JJ, et al. Nat Methods. 2014 Feb;11(2):149-55. doi: 10.1038/nmeth.2763. Epub 2013 Dec 8. Nat Methods. 2014. PMID: 24317253 Free PMC article. - Heritability and genetic basis of protein level variation in an outbred population.
Parts L, Liu YC, Tekkedil MM, Steinmetz LM, Caudy AA, Fraser AG, Boone C, Andrews BJ, Rosebrock AP. Parts L, et al. Genome Res. 2014 Aug;24(8):1363-70. doi: 10.1101/gr.170506.113. Epub 2014 May 13. Genome Res. 2014. PMID: 24823668 Free PMC article.
References
- Fleischmann RD, et al. Whole-genome random sequencing and assembly of Haemophilus influenzae Rd. Science. 1995;269(5223):496–512. - PubMed
- Venter JC, et al. The sequence of the human genome. Science. 2001;291(5507):1304–51. - PubMed
- Uhlen M, Graslund S, Sundstrom M. A pilot project to generate affinity reagents to human proteins. Nat Methods. 2008;5(10):854–5. - PubMed
- Taussig MJ, et al. ProteomeBinders: planning a European resource of affinity reagents for analysis of the human proteome. Nat Methods. 2007;4(1):13–7. - PubMed
- Berglund L, et al. A genecentric Human Protein Atlas for expression profiles based on antibodies. Mol Cell Proteomics. 2008;7(10):2019–27. - PubMed
Publication types
MeSH terms
Substances
Grants and funding
- RC2 HG005805/HG/NHGRI NIH HHS/United States
- N01-HV-28179/HV/NHLBI NIH HHS/United States
- N01HV28179/HV/NHLBI NIH HHS/United States
- P50 GM076547/GM/NIGMS NIH HHS/United States
- 233226/ERC_/European Research Council/International
LinkOut - more resources
Full Text Sources
Other Literature Sources
Molecular Biology Databases


