Occlusal effects on longitudinal bone alterations of the temporomandibular joint - PubMed (original) (raw)
doi: 10.1177/0022034512473482. Epub 2013 Jan 22.
K Jiao, M Zhang, T Zhou, X-D Liu, S-B Yu, L Lu, L Jing, T Yang, Y Zhang, D Chen, M-Q Wang
Affiliations
- PMID: 23340211
- PMCID: PMC6728563
- DOI: 10.1177/0022034512473482
Occlusal effects on longitudinal bone alterations of the temporomandibular joint
J Zhang et al. J Dent Res. 2013 Mar.
Abstract
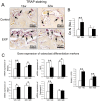
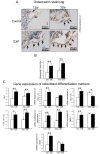
The pathological changes of subchondral bone during osteoarthritis (OA) development in the temporomandibular joint (TMJ) are poorly understood. In the present study, we investigated the longitudinal alterations of subchondral bone using a rat TMJ-OA model developed in our laboratory. Changes in bone mass were examined by micro-CT, and changes in osteoblast and osteoclast activities were analyzed by real-time PCR, immunohistochemistry, and TRAP staining. Subchondral bone loss was detected from 8 weeks after dental occlusion alteration and reached the maximum at 12 weeks, followed by a repair phase until 32 weeks. Although bone mass increased at late stages, poor mechanical structure and lower bone mineral density (BMD) were found in these rats. The numbers of TRAP-positive cells were increased at 12 weeks, while the numbers of osteocalcin-expressing cells were increased at both 12 and 32 weeks. Levels of mRNA expression of TRAP and cathepsin K were increased at 12 weeks, while levels of ALP and osteocalcin were increased at both 12 and 32 weeks. These findings demonstrated that there is an active bone remodeling in subchondral bone in TMJs in response to alteration in occlusion, although new bone was formed with lower BMD and poor mechanical properties.
Conflict of interest statement
The authors declare no potential conflicts of interest with respect to the authorship and/or publication of this article.
Figures
Figure 1.
In vivo micro-CT images of the TMJ condylar head from the control and experimental (EXP) groups. (A) The images were arranged from left to right according to the time sequence. Local subchondral bone lesions were observed in the experimental group. In general, the lesion regions (indicated by arrows) were larger at 12 wks after surgery than those at the other time-points. **(B)**Illustration of the methods for measuring the width (a–b) and length (c–d) of the condylar head. (a) The outermost point of the ventral contour of the condyle, (b) the outermost point of the dorsal contour of the condyle, (c) the most anterior point of the condyle, and (d) the most posterior point of the condyle. **(C)**Illustration of the method for locating the region of interest (ROI) for micro-CT analysis. The surface of the condylar head was equally divided into 3 parts, and the ROIs were located at the center of the middle and posterior parts.
Figure 2.
Subchondral bone loss in the TMJ condyle. (A) Micro-CT analysis showed that significant bone loss started from the end of 8 wks and reached the peak at around 12 wks. (B) Hematoxylin-eosin (HE) staining of sections showed larger trabecular spacing in both the 12- and 32-week experimental groups.(C) Histomorphological parameters confirmed the significant subchondral bone loss in both the 12- and 32-week experimental groups. The black areas show the selected regions used for analysis of the histomorphological parameters (*p < 0.05, **p < 0.01).
Figure 3.
Analysis of osteoclast activity in TMJ condylar subchondral bone. **(A)**TRAP staining of TMJ subchondral bone from 12- and 32-week control and experimental groups. (B) TRAP-positive cells with more than 3 nuclei were counted as the number of osteoclasts (Oc.N). (C) Real-time PCR analysis of expression of RANKL, OPG, TRAP, and _cathepsin K_genes from the subchondral bone of mandibular condylar heads in 12- and 32-week control and experimental groups (*p < 0.05, **p< 0.01).
Figure 4.
Analysis of osteoblast activity in TMJ condylar subchondral bone. **(A)**Osteocalcin immunohistochemical (IHC) staining of TMJ subchondral bone from 12- and 32-week control and experimental groups. (B) The number of osteocalcin-positive cells within the selected area was counted. **(C)**Real-time PCR analysis of expression of ALP, Col1a1, Col1a2, the ratio of Col1a1/Col1a2, osteocalcin, DMP-1, and _VEGF_genes from the subchondral bone of the mandibular condylar head in 12- and 32-week control and experimental groups (*p < 0.05, **p< 0.01).
Similar articles
- Decreased bone marrow stromal cells activity involves in unilateral anterior crossbite-induced early subchondral bone loss of temporomandibular joints.
Yang T, Zhang J, Cao Y, Zhang M, Jing L, Jiao K, Yu S, Wang M. Yang T, et al. Arch Oral Biol. 2014 Sep;59(9):962-9. doi: 10.1016/j.archoralbio.2014.05.024. Epub 2014 Jun 2. Arch Oral Biol. 2014. PMID: 24929626 - Long-term haplodeficency of DSPP causes temporomandibular joint osteoarthritis in mice.
Liu Q, Zhao Y, Shi H, Xiang D, Wu C, Song L, Ma N, Sun H. Liu Q, et al. BMC Oral Health. 2024 May 14;24(1):569. doi: 10.1186/s12903-024-04320-8. BMC Oral Health. 2024. PMID: 38745274 Free PMC article. - Osteochondral Interface Stiffening in Mandibular Condylar Osteoarthritis.
Zhang J, Liao L, Zhu J, Wan X, Xie M, Zhang H, Zhang M, Lu L, Yang H, Jing D, Liu X, Yu S, Lu XL, Chen C, Shan Z, Wang M. Zhang J, et al. J Dent Res. 2018 May;97(5):563-570. doi: 10.1177/0022034517748562. Epub 2018 Jan 3. J Dent Res. 2018. PMID: 29298566 - [Temporomandibular joint (TMJ): Condyle hyperplasia and condylectomy].
Ferri J, Raoul G, Potier J, Nicot R. Ferri J, et al. Rev Stomatol Chir Maxillofac Chir Orale. 2016 Sep;117(4):259-65. doi: 10.1016/j.revsto.2016.07.021. Epub 2016 Aug 23. Rev Stomatol Chir Maxillofac Chir Orale. 2016. PMID: 27567190 Review. French. - Intra-articular disc displacement Part II: Its significant role in temporomandibular joint pathology.
Hall HD. Hall HD. J Oral Maxillofac Surg. 1995 Sep;53(9):1073-9. doi: 10.1016/0278-2391(95)90127-2. J Oral Maxillofac Surg. 1995. PMID: 7643278 Review. No abstract available.
Cited by
- The adaptive response of the mandibular condyle to increased load is disrupted by ADAMTS5 deficiency.
C Porto S, Rogers-DeCotes A, Schafer E, B Kern C. C Porto S, et al. Connect Tissue Res. 2023 Jan;64(1):93-104. doi: 10.1080/03008207.2022.2102491. Epub 2022 Aug 1. Connect Tissue Res. 2023. PMID: 35913086 Free PMC article. - Micro-CT analysis of the rodent jaw bone micro-architecture: A systematic review.
Faot F, Chatterjee M, de Camargos GV, Duyck J, Vandamme K. Faot F, et al. Bone Rep. 2015 Jan 21;2:14-24. doi: 10.1016/j.bonr.2014.10.005. eCollection 2015 Jun. Bone Rep. 2015. PMID: 28525530 Free PMC article. Review. - Wnt/β-catenin signaling pathway is activated in the progress of mandibular condylar cartilage degeneration and subchondral bone loss induced by overloaded functional orthopedic force (OFOF).
He Z, Liu M, Zhang Q, Tian Y, Wang L, Yan X, Ren D, Yuan X. He Z, et al. Heliyon. 2022 Oct 1;8(10):e10847. doi: 10.1016/j.heliyon.2022.e10847. eCollection 2022 Oct. Heliyon. 2022. PMID: 36262297 Free PMC article. - The Nrf2 Pathway Alleviates Overloading Force-Induced TMJ Degeneration by Downregulating Oxidative Stress Reactions.
Xu M, Fang L, Xue Q, Zhang X, He Y. Xu M, et al. J Inflamm Res. 2023 Nov 27;16:5601-5612. doi: 10.2147/JIR.S434799. eCollection 2023. J Inflamm Res. 2023. PMID: 38046402 Free PMC article. - Histological and Biochemical Analysis after Posterior Mandibular Displacement in Rats.
Lyros I, Perrea D, Tosios K, Nikitakis N, Tsolakis IA, Ferdianakis E, Fora E, Lykogeorgos T, Maroulakos MP, Vardas E, Georgaki M, Papadopoulou E, Tsolakis AI. Lyros I, et al. Vet Sci. 2022 Nov 10;9(11):625. doi: 10.3390/vetsci9110625. Vet Sci. 2022. PMID: 36356102 Free PMC article.
References
- Bailey AJ, Buckland-Wright C, Metz D. (2001). The role of bone in osteoarthritis. Age Ageing 30:374-378. - PubMed
- Bailey AJ, Sims TJ, Knott L. (2002). Phenotypic expression of osteoblast collagen in osteoarthritic bone: production of type I homotrimer. Int J Biochem Cell Biol 34:176-182. - PubMed
- Bouchgua M, Alexander K, Carmel EN, d’Anjou MA, Beauchamp G, Richard H, et al. (2009). Use of routine clinical multimodality imaging in a rabbit model of osteoarthritis—Part II: bone mineral density assessment. Osteoarthritis Cartilage 17:197-204. - PubMed
- Chiba K, Ito M, Osaki M, Uetani M, Shindo H. (2011). In vivo structural analysis of subchondral trabecular bone in osteoarthritis of the hip using multi-detector row CT. Osteoarthritis Cartilage 19:180-185. - PubMed
- Cowin SC. (2004). Tissue growth and remodeling. Annu Rev Biomed Eng 6:77-107. - PubMed
Publication types
MeSH terms
Substances
LinkOut - more resources
Full Text Sources
Other Literature Sources
Medical


