A cross-platform analysis of 14,177 expression quantitative trait loci derived from lymphoblastoid cell lines - PubMed (original) (raw)
A cross-platform analysis of 14,177 expression quantitative trait loci derived from lymphoblastoid cell lines
Liming Liang et al. Genome Res. 2013 Apr.
Abstract
Gene expression levels can be an important link DNA between variation and phenotypic manifestations. Our previous map of global gene expression, based on ~400K single nucleotide polymorphisms (SNPs) and 50K transcripts in 400 sib pairs from the MRCA family panel, has been widely used to interpret the results of genome-wide association studies (GWASs). Here, we more than double the size of our initial data set with expression data on 550 additional individuals from the MRCE family panel using the Illumina whole-genome expression array. We have used new statistical methods for dimension reduction to account for nongenetic effects in estimates of expression levels, and we have also included SNPs imputed from the 1000 Genomes Project. Our methods reduced false-discovery rates and increased the number of expression quantitative trait loci (eQTLs) mapped either locally or at a distance (i.e., in cis or trans) from 1534 in the MRCA data set to 4452 (with <5% FDR). Imputation of 1000 Genomes SNPs further increased the number of eQTLs to 7302. Using the same methods and imputed SNPs in the newly acquired MRCE data set, we identified eQTLs for 9000 genes. The combined results identify strong local and distant effects for transcripts from 14,177 genes. Our eQTL database based on these results is freely available to help define the function of disease-associated variants.
Figures
Figure 1.
Empirical estimate of false discovery rate. (noPC) Using original expression value; (PC) adjusting nongenetic effect using the top 69 principal components; (1000G) imputation using SNPs from the 1000 Genomes project; (HapMap) imputation using HapMap2 SNPs; (300K) using autosomal SNPs from the Illumina 300K panel.
Figure 2.
Replication rate by distance from the eQTL to the transcript. (Red lines) Replication of eQTL. (A) Local effect; (B) distant syntenic effect (>1 Mb but gene and SNP on the same chromosome); and (C) distant effect (on a different chromosome). The analysis is based on autosomal SNPs from the Illumina 300K panel.
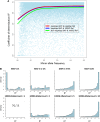
Figure 3.
Imputation accuracy by minor allele frequency (MAF; MRCA panel). (A) Correlation (_R_2) between 1000G imputed allele dosage derived from Illumina 300K arrays and true allele counts measured by Illumina 100K arrays, plotted by MAF. (B) Histogram of correlation with true allele counts by MAF in sample (upper panels) and minor allele counts in the 1000G reference haplotype. Note that there are no data in the bottom left panel following removal of singletons from the reference haplotype.
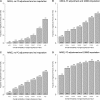
Figure 4.
Comparison of number of local eQTLs identified by directly genotyped SNPs, imputed HapMap2 SNPs, and imputed SNPs from the 1000 Genomes Project. (A) Results from Affymetrix expression data in the MRCA panel. (B) Results from Illumina expression data in the MRCE panel. (Blue bars) Original unadjusted expression; (red bars) expression values adjusted by the top principal components.
Figure 5.
Proportion of significant transcripts by overall heritability. (A) Unadjusted expression data and SNPs from the Illumina 300K panel in the MRCA subjects. (B) PC-adjusted expression data and the imputation of 1000G SNPs in the MRCA subjects. (C) Unadjusted expression data and SNPs from the Illumina 300K panel in the MRCE subjects. (D) PC-adjusted expression data and the imputation of 1000G SNPs in the MRCE subjects. The number of transcripts in each heritability category is given at the bottom of each bar.
Figure 6.
cis eQTL of the gene TIMM22. A map of association of SNPs to transcript abundance of the TIMM22 gene exemplifies the progressive increase in information for the experimental genotypes (A), experimental plus HapMap imputed SNPs (B), and experimental, HapMap imputed and 1000G imputed SNPs (C). The gray vertical bar at the gene TIMM22 indicates the position of the Affymetrix probe
Similar articles
- Integrated genome-wide analysis of expression quantitative trait loci aids interpretation of genomic association studies.
Joehanes R, Zhang X, Huan T, Yao C, Ying SX, Nguyen QT, Demirkale CY, Feolo ML, Sharopova NR, Sturcke A, Schäffer AA, Heard-Costa N, Chen H, Liu PC, Wang R, Woodhouse KA, Tanriverdi K, Freedman JE, Raghavachari N, Dupuis J, Johnson AD, O'Donnell CJ, Levy D, Munson PJ. Joehanes R, et al. Genome Biol. 2017 Jan 25;18(1):16. doi: 10.1186/s13059-016-1142-6. Genome Biol. 2017. PMID: 28122634 Free PMC article. - ncRNA-eQTL: a database to systematically evaluate the effects of SNPs on non-coding RNA expression across cancer types.
Li J, Xue Y, Amin MT, Yang Y, Yang J, Zhang W, Yang W, Niu X, Zhang HY, Gong J. Li J, et al. Nucleic Acids Res. 2020 Jan 8;48(D1):D956-D963. doi: 10.1093/nar/gkz711. Nucleic Acids Res. 2020. PMID: 31410488 Free PMC article. - Endometrial vezatin and its association with endometriosis risk.
Holdsworth-Carson SJ, Fung JN, Luong HT, Sapkota Y, Bowdler LM, Wallace L, Teh WT, Powell JE, Girling JE, Healey M, Montgomery GW, Rogers PA. Holdsworth-Carson SJ, et al. Hum Reprod. 2016 May;31(5):999-1013. doi: 10.1093/humrep/dew047. Epub 2016 Mar 22. Hum Reprod. 2016. PMID: 27005890 - Expression Quantitative Trait Loci Information Improves Predictive Modeling of Disease Relevance of Non-Coding Genetic Variation.
Croteau-Chonka DC, Rogers AJ, Raj T, McGeachie MJ, Qiu W, Ziniti JP, Stubbs BJ, Liang L, Martinez FD, Strunk RC, Lemanske RF Jr, Liu AH, Stranger BE, Carey VJ, Raby BA. Croteau-Chonka DC, et al. PLoS One. 2015 Oct 16;10(10):e0140758. doi: 10.1371/journal.pone.0140758. eCollection 2015. PLoS One. 2015. PMID: 26474488 Free PMC article. Review. - eQTL analysis in mice and rats.
Tesson BM, Jansen RC. Tesson BM, et al. Methods Mol Biol. 2009;573:285-309. doi: 10.1007/978-1-60761-247-6_16. Methods Mol Biol. 2009. PMID: 19763934 Review.
Cited by
- Recent positive selection has acted on genes encoding proteins with more interactions within the whole human interactome.
Luisi P, Alvarez-Ponce D, Pybus M, Fares MA, Bertranpetit J, Laayouni H. Luisi P, et al. Genome Biol Evol. 2015 Apr 2;7(4):1141-54. doi: 10.1093/gbe/evv055. Genome Biol Evol. 2015. PMID: 25840415 Free PMC article. - Gene expression in transformed lymphocytes reveals variation in endomembrane and HLA pathways modifying cystic fibrosis pulmonary phenotypes.
O'Neal WK, Gallins P, Pace RG, Dang H, Wolf WE, Jones LC, Guo X, Zhou YH, Madar V, Huang J, Liang L, Moffatt MF, Cutting GR, Drumm ML, Rommens JM, Strug LJ, Sun W, Stonebraker JR, Wright FA, Knowles MR. O'Neal WK, et al. Am J Hum Genet. 2015 Feb 5;96(2):318-28. doi: 10.1016/j.ajhg.2014.12.022. Epub 2015 Jan 29. Am J Hum Genet. 2015. PMID: 25640674 Free PMC article. - Integrated genomics analysis highlights important SNPs and genes implicated in moderate-to-severe asthma based on GWAS and eQTL datasets.
Dong Z, Ma Y, Zhou H, Shi L, Ye G, Yang L, Liu P, Zhou L. Dong Z, et al. BMC Pulm Med. 2020 Oct 16;20(1):270. doi: 10.1186/s12890-020-01303-7. BMC Pulm Med. 2020. PMID: 33066754 Free PMC article. - An evolutionary analysis of antigen processing and presentation across different timescales reveals pervasive selection.
Forni D, Cagliani R, Tresoldi C, Pozzoli U, De Gioia L, Filippi G, Riva S, Menozzi G, Colleoni M, Biasin M, Lo Caputo S, Mazzotta F, Comi GP, Bresolin N, Clerici M, Sironi M. Forni D, et al. PLoS Genet. 2014 Mar 27;10(3):e1004189. doi: 10.1371/journal.pgen.1004189. eCollection 2014 Mar. PLoS Genet. 2014. PMID: 24675550 Free PMC article. - A common variant in RAB27A gene is associated with fractional exhaled nitric oxide levels in adults.
Bouzigon E, Nadif R, Thompson EE, Concas MP, Kuldanek S, Du G, Brossard M, Lavielle N, Sarnowski C, Vaysse A, Dessen P, van der Valk RJ, Duijts L, Henderson AJ, Jaddoe VW, de Jongste JC; GABRIEL consortium; Casula S, Biino G, Dizier MH, Pin I, Matran R, Lathrop M, Pirastu M, Demenais F, Ober C; Early Genetics Lifecourse Epidemiology (EAGLE) Consortium. Bouzigon E, et al. Clin Exp Allergy. 2015 Apr;45(4):797-806. doi: 10.1111/cea.12461. Clin Exp Allergy. 2015. PMID: 25431337 Free PMC article.
References
- Abecasis GR, Cherny SS, Cookson WO, Cardon LR 2002. Merlin–rapid analysis of dense genetic maps using sparse gene flow trees. Nat Genet 30: 97–101 - PubMed
- Akey JM, Biswas S, Leek JT, Storey JD 2007. On the design and analysis of gene expression studies in human populations. Nat Genet 39: 807–808 - PubMed
- Benjamini Y, Hochberg Y 1995. Controlling the false discovery rate: A practical and powerful approach to multiple testing. J R Stat Soc Ser B Methodol 57: 289–300
Publication types
MeSH terms
LinkOut - more resources
Full Text Sources
Other Literature Sources
Molecular Biology Databases


