Distinct distal gut microbiome diversity and composition in healthy children from Bangladesh and the United States - PubMed (original) (raw)
Distinct distal gut microbiome diversity and composition in healthy children from Bangladesh and the United States
Audrie Lin et al. PLoS One. 2013.
Abstract
Background: Our current understanding of the composition and stability of the human distal gut microbiota is based largely on studies of infants and adults living in developed countries. In contrast, little is known about the gut microbiota and its variation over time in older children and adolescents, especially in developing countries.
Methodology/principal findings: We compared the diversity, composition, and temporal stability of the fecal microbiota of healthy children, ages 9 to 14 years, living in an urban slum in Bangladesh with that of children of the same age range in an upper-middle class suburban community in the United States. We analyzed >8,000 near full-length 16S rRNA gene sequences and over 845,000 pyrosequencing reads of the 16S rRNA V1-V3 region. The distal gut of Bangladeshi children harbored significantly greater bacterial diversity than that of U.S. children, including novel lineages from several bacterial phyla. Bangladeshi and U.S. children had distinct fecal bacterial community membership and structure; the microbiota of Bangladeshi children was enriched in Prevotella, Butyrivibrio, and Oscillospira and depleted in Bacteroides relative to U.S. children (although similar to Bangladeshi adults). Furthermore, community membership and structure in Bangladeshi children was significantly less stable month-to-month than U.S. children.
Conclusions/significance: Together, these results suggest that differing environmental or genetic factors may shape the microbiota of healthy children in the two countries. Further investigation is necessary to understand the mechanisms and factors that underlie these differences, and to incorporate these findings into new strategies for the prevention and treatment of childhood and adolescent diseases.
Conflict of interest statement
Competing Interests: The authors have declared that no competing interests exist.
Figures
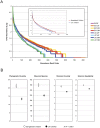
Figure 1. Alpha diversity based on 16S rDNA V1–V3 sequence data.
(A) Rank abundance curves. The vertical axis displays OTU relative abundance on a logarithmic scale. The horizontal axis lists the OTUs in rank order of descending abundance. (B) Alpha diversity statistics. Phylogenetic Diversity (PD) is the minimum total branch length of the phylogenetic tree that incorporates all OTUs in a sample. The number of observed species was calculated at a similarity threshold of 97%. Shannon Diversity index (H) characterizes species diversity and accounts for abundance and evenness of the species. Shannon equitability index (EH) is a measure of evenness. If S is the number of observed species, then EH = H/ln (S). Due to the unequal number of measurements in the time series for each child (5 for Bangladeshi children and 6 for U.S. children), all 5 monthly measurements from each of 4 Bangladeshi children and the first 5 monthly measurements from each of 4 U.S. children were averaged. Only samples from the children (BC and UC participants) were included in this alpha diversity analysis (Table 1). Error bars represent the standard error of the mean (SEM).
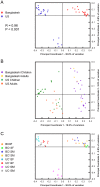
Figure 2. Principal Coordinates Analysis of unweighted UniFrac distances for 16S rDNA V1–V3 sequence data.
Beta diversity patterns were explored using Principal Coordinates Analysis (PCoA). Samples were rarefied to 6,596 reads/sample for Figs. 2A and 2C and rarefied to 427 reads/sample for 2B due to the smaller number of available reads per U.S. adult. The near full-length 16S rDNA data were not included in this analysis. (A) The sample symbols for Bangladeshi and U.S. children are colored by country. Only the data from the children (with the exception of BK8F and BK9F) were included in this PCoA plot. (B) Nine U.S. adults were included in this analysis (one time point per adult). The fecal communities for all three subjects (Subjects A, B, and C) in the Eckburg et al. study (near full-length 16S rDNA sequences) and all 6 subjects (Subjects A, B, C, D, E, F) in the Dethlefsen et al. studies (V1–V3 16S rDNA sequences) were included in the analysis , , . The near full-length 16S rDNA sequences were filtered in silico to the V1–V3 regions using ARB. Data from all of the children were included in this analysis. (C) Same as (A) but with each sample symbol colored-coded by subject.
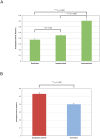
Figure 3. Mean pairwise unweighted UniFrac distance for subsets of samples.
Mean pairwise unweighted UniFrac distance reflecting (A) sample-to-sample variation among replicates (left), within individuals over time (center), and between individuals (right), and (B) the average month-to-month intraindividual variation (distances between samples spanning one month) within Bangladeshi children (left) and within U.S. children (right). In A, the replicates from all six Bangladeshi adults and U.S. child 10 M were included in the analysis (Table 1). In all others (A and B), UniFrac distance calculations excluded the two additional Bangladeshi children (BK) and the Bangladeshi adult (BA) subjects because only one sample was collected from each of these individuals (Table 1). Means are shown ± SEM, and p-values were calculated by a two-tailed t-test with unequal variance.
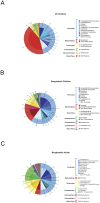
Figure 4. Mean relative abundance of bacterial taxa (≥1%) in the V1–V3 16S rDNA sequence data.
The composition of the distal gut microbiota of (A) U.S. children (B) Bangladeshi children, and (C) Bangladeshi adults is displayed. The outer ring reflects the mean relative abundance of the most abundant phyla (e.g., Firmicutes, blue; Bacteroidetes, red) and the inner ring represents the most abundant genera (with a gradient of shading corresponding to the phylum colors). Only U.S. children, Bangladeshi children, and Bangladeshi adult subjects were included in this analysis.
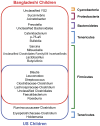
Figure 5. Venn diagram of the exclusive and shared genera of Bangladeshi and U.S. children based on V1–V3 16S rDNA sequence data.
The G test of independence was used to determine whether genus presence or absence was associated with one group of children or the other. A list of the most significant genera was compiled based on FDR-corrected p-values. Furthermore, to qualify for a specific country group, the genus had to be observed ≥5 times for each time point within an individual and within all individuals in a country group. The genera exclusively found in Bangladeshi or U.S. children are outlined in red and blue, respectively. The overlapping area between the two groups represents the genera that are shared by all individuals from both countries. The size of each enclosed area is directly proportional to the number of genera that are found in each group. The genera are colored-coded according to the list of phyla on the right. Only U.S. children and Bangladeshi children were included in this analysis.
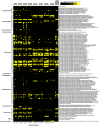
Figure 6. Heat map of the relative abundance of genera found in the V1–V3 16S rDNA sequence data.
Data from U.S children, Bangladeshi children, and Bangladeshi adults were rarefied to the same number of reads per sample to normalize for the unequal sampling effort. Only genera with a total normalized abundance of at least ten reads are displayed. Color intensity is proportional to the relative abundance of the taxon and is represented by the scale (black, 0% present; yellow, ≥10% present).
Figure 7. Phylogeny of the most novel OTUs found in the distal gut microbiota of children from Bangladesh.
Neighbor joining tree based on near full-length 16S rDNA sequences showing the 27 OTU representatives (in bold) from the Bangladesh dataset that have less than 95% sequence similarity to published sequences, and their Genbank accession numbers. The tree was rooted with the archaeal 16S ribosomal RNA gene from Halococcus morrhuae (X00662). The number of clones for each OTU in the near full-length dataset is shown in parentheses. Their closest publicly-available sequences are shown in gray font. The horizontal scale bar indicates 10% sequence divergence.
Similar articles
- Comparative analysis of Korean human gut microbiota by barcoded pyrosequencing.
Nam YD, Jung MJ, Roh SW, Kim MS, Bae JW. Nam YD, et al. PLoS One. 2011;6(7):e22109. doi: 10.1371/journal.pone.0022109. Epub 2011 Jul 29. PLoS One. 2011. PMID: 21829445 Free PMC article. - Persistent gut microbiota immaturity in malnourished Bangladeshi children.
Subramanian S, Huq S, Yatsunenko T, Haque R, Mahfuz M, Alam MA, Benezra A, DeStefano J, Meier MF, Muegge BD, Barratt MJ, VanArendonk LG, Zhang Q, Province MA, Petri WA Jr, Ahmed T, Gordon JI. Subramanian S, et al. Nature. 2014 Jun 19;510(7505):417-21. doi: 10.1038/nature13421. Epub 2014 Jun 4. Nature. 2014. PMID: 24896187 Free PMC article. - Human gut microbiome viewed across age and geography.
Yatsunenko T, Rey FE, Manary MJ, Trehan I, Dominguez-Bello MG, Contreras M, Magris M, Hidalgo G, Baldassano RN, Anokhin AP, Heath AC, Warner B, Reeder J, Kuczynski J, Caporaso JG, Lozupone CA, Lauber C, Clemente JC, Knights D, Knight R, Gordon JI. Yatsunenko T, et al. Nature. 2012 May 9;486(7402):222-7. doi: 10.1038/nature11053. Nature. 2012. PMID: 22699611 Free PMC article. - Diversity, stability and resilience of the human gut microbiota.
Lozupone CA, Stombaugh JI, Gordon JI, Jansson JK, Knight R. Lozupone CA, et al. Nature. 2012 Sep 13;489(7415):220-30. doi: 10.1038/nature11550. Nature. 2012. PMID: 22972295 Free PMC article. Review. - Microbes inside--from diversity to function: the case of Akkermansia.
Belzer C, de Vos WM. Belzer C, et al. ISME J. 2012 Aug;6(8):1449-58. doi: 10.1038/ismej.2012.6. Epub 2012 Mar 22. ISME J. 2012. PMID: 22437156 Free PMC article. Review.
Cited by
- Intestinal microbiota and diet in IBS: causes, consequences, or epiphenomena?
Rajilić-Stojanović M, Jonkers DM, Salonen A, Hanevik K, Raes J, Jalanka J, de Vos WM, Manichanh C, Golic N, Enck P, Philippou E, Iraqi FA, Clarke G, Spiller RC, Penders J. Rajilić-Stojanović M, et al. Am J Gastroenterol. 2015 Feb;110(2):278-87. doi: 10.1038/ajg.2014.427. Epub 2015 Jan 27. Am J Gastroenterol. 2015. PMID: 25623659 Free PMC article. Review. - The intestinal microbiome in early life: health and disease.
Arrieta MC, Stiemsma LT, Amenyogbe N, Brown EM, Finlay B. Arrieta MC, et al. Front Immunol. 2014 Sep 5;5:427. doi: 10.3389/fimmu.2014.00427. eCollection 2014. Front Immunol. 2014. PMID: 25250028 Free PMC article. Review. - Faecal microbiome in new-onset juvenile idiopathic arthritis.
Tejesvi MV, Arvonen M, Kangas SM, Keskitalo PL, Pirttilä AM, Karttunen TJ, Vähäsalo P. Tejesvi MV, et al. Eur J Clin Microbiol Infect Dis. 2016 Mar;35(3):363-70. doi: 10.1007/s10096-015-2548-x. Epub 2015 Dec 30. Eur J Clin Microbiol Infect Dis. 2016. PMID: 26718942 - HIV DNA-Adenovirus Multiclade Envelope Vaccine Induces gp41 Antibody Immunodominance in Rhesus Macaques.
Han Q, Williams WB, Saunders KO, Seaton KE, Wiehe KJ, Vandergrift N, Von Holle TA, Trama AM, Parks RJ, Luo K, Gurley TC, Kepler TB, Marshall DJ, Montefiori DC, Sutherland LL, Alam MS, Whitesides JF, Bowman CM, Permar SR, Graham BS, Mascola JR, Seed PC, Van Rompay KKA, Tomaras GD, Moody MA, Haynes BF. Han Q, et al. J Virol. 2017 Oct 13;91(21):e00923-17. doi: 10.1128/JVI.00923-17. Print 2017 Nov 1. J Virol. 2017. PMID: 28794027 Free PMC article. - Molecular Characterization and Meta-Analysis of Gut Microbial Communities Illustrate Enrichment of Prevotella and Megasphaera in Indian Subjects.
Bhute S, Pande P, Shetty SA, Shelar R, Mane S, Kumbhare SV, Gawali A, Makhani H, Navandar M, Dhotre D, Lubree H, Agarwal D, Patil R, Ozarkar S, Ghaskadbi S, Yajnik C, Juvekar S, Makharia GK, Shouche YS. Bhute S, et al. Front Microbiol. 2016 May 9;7:660. doi: 10.3389/fmicb.2016.00660. eCollection 2016. Front Microbiol. 2016. PMID: 27242691 Free PMC article.
References
- UNICEF (2011) Adolescence: an age of opportunity. New York 138.
- Humphrey JH (2009) Child undernutrition, tropical enteropathy, toilets, and handwashing. Lancet 374: 1032–1035. - PubMed
- Campbell DI, Lunn PG, Elia M (2002) Age-related association of small intestinal mucosal enteropathy with nutritional status in rural Gambian children. Br J Nutr 88: 499–505. - PubMed
Publication types
MeSH terms
Substances
Grants and funding
- 5R01AI043596/AI/NIAID NIH HHS/United States
- DP1OD000964/OD/NIH HHS/United States
- 1UL1 RR025744/RR/NCRR NIH HHS/United States
- R01 AI053724/AI/NIAID NIH HHS/United States
- AI 53724/AI/NIAID NIH HHS/United States
- UL1 RR025744/RR/NCRR NIH HHS/United States
- UL1 TR001085/TR/NCATS NIH HHS/United States
- R21 AI069382/AI/NIAID NIH HHS/United States
- AI 069382/AI/NIAID NIH HHS/United States
- R01 AI043596/AI/NIAID NIH HHS/United States
- DP1 OD000964/OD/NIH HHS/United States
LinkOut - more resources
Full Text Sources
Other Literature Sources
Molecular Biology Databases
