TET2 and TET3 regulate GlcNAcylation and H3K4 methylation through OGT and SET1/COMPASS - PubMed (original) (raw)
. 2013 Mar 6;32(5):645-55.
doi: 10.1038/emboj.2012.357. Epub 2013 Jan 25.
Benjamin Delatte, Marie K Schwinn, Matthieu Defrance, Jacqui Méndez, Nancy Murphy, Mark A Dawson, Michael Volkmar, Pascale Putmans, Emilie Calonne, Alan H Shih, Ross L Levine, Olivier Bernard, Thomas Mercher, Eric Solary, Marjeta Urh, Danette L Daniels, François Fuks
Affiliations
- PMID: 23353889
- PMCID: PMC3590984
- DOI: 10.1038/emboj.2012.357
TET2 and TET3 regulate GlcNAcylation and H3K4 methylation through OGT and SET1/COMPASS
Rachel Deplus et al. EMBO J. 2013.
Abstract
TET proteins convert 5-methylcytosine to 5-hydroxymethylcytosine, an emerging dynamic epigenetic state of DNA that can influence transcription. Evidence has linked TET1 function to epigenetic repression complexes, yet mechanistic information, especially for the TET2 and TET3 proteins, remains limited. Here, we show a direct interaction of TET2 and TET3 with O-GlcNAc transferase (OGT). OGT does not appear to influence hmC activity, rather TET2 and TET3 promote OGT activity. TET2/3-OGT co-localize on chromatin at active promoters enriched for H3K4me3 and reduction of either TET2/3 or OGT activity results in a direct decrease in H3K4me3 and concomitant decreased transcription. Further, we show that Host Cell Factor 1 (HCF1), a component of the H3K4 methyltransferase SET1/COMPASS complex, is a specific GlcNAcylation target of TET2/3-OGT, and modification of HCF1 is important for the integrity of SET1/COMPASS. Additionally, we find both TET proteins and OGT activity promote binding of the SET1/COMPASS H3K4 methyltransferase, SETD1A, to chromatin. Finally, studies in Tet2 knockout mouse bone marrow tissue extend and support the data as decreases are observed of global GlcNAcylation and also of H3K4me3, notably at several key regulators of haematopoiesis. Together, our results unveil a step-wise model, involving TET-OGT interactions, promotion of GlcNAcylation, and influence on H3K4me3 via SET1/COMPASS, highlighting a novel means by which TETs may induce transcriptional activation.
Conflict of interest statement
Promega Corporation is the commercial owner by assignment of patents of the HaloTag technology and its applications.
Figures
Figure 1
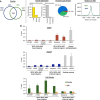
TET2 and TET3 associate with the _O_-GlcNAc transferase OGT and promote GlcNAcylation. (A) Silver stain gel of HaloTag-TET protein complex isolations and HaloTag alone control (Ctrl). Protein pulldowns were performed from HEK293T cells overexpressing the indicated HT constructs (see Materials and methods and Supplementary Figure 1 for details). As not all of the indicated complex isolations were performed at the same time, two separate silver stain gels were run, as shown in this panel. (B) Table of transcriptional or chromatin protein interactors found in the various HaloTag-TET isolations. Spectral counts for each interacting protein are shown for biological replicates. TET1, but not TET2, as previously reported (Williams et al, 2011; Wu et al, 2011), shows interaction with SIN3A. OGT interacts with all TET proteins, though it is most highly abundant with TET2 and TET3. (C) Detection of OGT by western blotting from HT-TET2 and HT-TET3 pulldowns from (A). The indicated pulldowns were probed with an anti-OGT antibody to detect the presence of OGT. OGT and beta-Actin shown as input loading controls. (D) TET2 and TET3 co-immunoprecipitate (CoIP) with endogenous OGT from untransfected HEK293T cells. Cell extracts were immunoprecipitated with anti-OGT or rabbit IgG and probed with antibodies against the indicated proteins. An IP control of OGT alone is shown to demonstrate specific capture and enrichment of OGT. Inputs loading controls are shown for all. Note that in this experiment very weak expression of TET2 relative to TET3 is observed. (E) The global level of hmC does not change after cell treatment with Alloxan or PUGNAc. Dot blot quantification of global hmC after the indicated treatments. The hmC content is normalized with respect to the input DNA and to mock-treated cells, where the ratio is set at 1.00. Error bars indicate s.d. of three independent experiments. As controls, western blots using anti-_O_-GlcNAc antibody show the expected decrease in GlcNAcylation with Alloxan and increase with PUGNAc. HDAC1 input loading controls are also shown. Vertical line indicates juxtaposition of lanes non-adjacent within the same blot, exposed for the same time. (F) Global decrease in GlcNAcylation is observed in TET2/3 knockdowns. Left: TET2 kd or TET3 kd show decreased GlcNAc activity. Nuclear extracts were prepared from HEK293T cells expressing RNAi Ctrl, RNAi TET2, or RNAi TET3, and UDP-[3H]GlcNAc incorporation was measured. The amount incorporated into the control cells was set at 1. Error bars indicate s.d. of three independent experiments (*P<0.05). Right: Nuclear extracts were prepared from HEK293T cells expressing RNAi Ctrl or RNAi TET2/3 and global GlcNAcylation was visualized with an antibody against _O_-GlcNAc. HDAC1 input loading control is also shown.
Figure 2
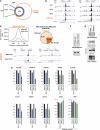
TET2/3–OGT show genomic co-localization around TSSs and impact on H3K4me3 and transcriptional activation. (A) Left: Venn diagrams indicating significant overlap of TET2 and OGT bound regions (left part; _P_-value<10−10) identified after HaloCHIP-Seq in HEK293T cells expressing HT-TET2, or HT-OGT. Right: TET2–OGT targets are primarily found at TSSs and CpG-rich sequences. Similar profiles were also observed for TET3–OGT (Supplementary Figure 8). (B) An analysed subset of TET2–TET3–OGT targets show a lack of DNA methylation and hydroxymethylation, yet display GlcNAcylation. qPCR analysis of TET2–TET3–OGT binding and non-binding regions after MeDIP (top), hMeDIP (middle), or ChIP with an anti-_O_-GlcNAc antibody (bottom). ‘% Input’ represents real-time qPCR values normalized with respect to the input chromatin. Known methylated and hydroxymethylated regions are shown as positive controls in MeDIP and hMeDIP panels.
Figure 2
(C) TET2/3–OGT targets in HEK293T cells are enriched for H3K4me3 as depicted in a Venn diagram; _P_-value<10−10. (D) Examples of HaloCHIP-Seq OGT, TET2, TET3, and ChIP-Seq H3K4me3 profiles (UCSC tracks). (E) Decreased levels of H3K4me3 in TET2 kd cells. Upper-left: decrease in the normalized number of H3K4me3 reads in TET2/3–OGT-binding regions in TET2 kd cells versus control RNAi-treated cells. Upper-right: pie chart showing the percentage of TET2–TET3–OGT binding regions with a statistically significant reduction of the normalized number of H3K4me3 reads for TET2 kd versus control RNAi-treated cells. Lower-part: examples of H3K4me3 ChIP-Seq profiles (UCSC tracks) in TET2–TET3–OGT-binding regions for the RNAi control versus TET2 kd sample. (F) Western blot showing global decrease in H3K4me3 in a TET2/3 double kd cells. Lysates from mock HEK293T RNAi kd or TET2/3 kd cells were probed for H3K4me3 using an anti-H3K4 antibody in western blot. Tubulin is shown as a loading control. (G) OGT activity is important for H3K4me3. Cell extracts were prepared from HEK293T cells treated with or without the OGT inhibitor Alloxan, and then western blots for H3K4me3 were performed. HDAC1 and H3 are shown as loading controls and a western blot against _O_-GlcNAc was used to monitor specific GlcNAcylation inhibition by Alloxan. Vertical lines indicate juxtaposition of lanes non-adjacent within the same blot, exposed for the same time. (H) Decreases in transcription are observed in both TET2/3 knockdowns and an OGT knockdown. The indicated target genes (which showed decrease in H3K4me3 after TET2 kd; cf. E) and negative controls (unbound TET2/3–OGT–H3K4me3 targets), were analysed by RT–qPCR in HEK293T cells subjected to the various listed RNAi treatments. Independent experiments were performed in duplicates.
Figure 3
TET2/3 promotes GlcNAcylation of HCF1, and both TET and OGT activity favour the integrity of SET1/COMPASS and SETD1A binding to chromatin. (A) Mass spectrometry reveals HCF1, a known target of OGT (Wysocka et al, 2003) and component of SET1/COMPASS (Lee et al, 2010), as an interacting partner of HT-TET2 and HT-TET3. Biological duplicates and respective spectral counts (SpC) for HCF1 are shown. (B) Protein pulldowns of HT-OGT coupled with mass spectrometry identify HCF1, TET2, TET3, and all components of SET1/COMPASS as partners of OGT. Biological duplicates and SpC for each protein identified are shown for HT-OGT and Ctrl isolations. (C) The interaction of HCF1 and SET1/COMPASS components with HT-OGT depends on _O_-GlcNAc activity. Plot showing average SpCs for HCF1 and SET1/COMPASS components isolated from HT-OGT pulldowns of untreated (grey bars) and Alloxan-treated (green bars) HEK293T cells. Error bars represent s.d. of biological duplicates. Representative NSAF plots are shown in Supplementary Figure 11. (D) The interaction of HT-SETD1A with SET1/COMPASS components and OGT is reduced by a TET2/3 double kd. Plot showing average SpCs for SET1/COMPASS components and OGT isolated from HT-SETD1A pulldowns of control RNAi-treated (grey bars) and TET2/3 kd (blue bars) HEK293T cells. Error bars represent s.d. of biological duplicates. Representative NSAF plots are shown in Supplementary Figure 11. (E) A significant reduction in HCF1 GlcNAcylation is observed after TET2/3 double kd. Upper diagram shows a schematic representation of full-length HCF1 and its domains (Capotosti et al, 2011). The GlcNAcylated peptides identified by mass spectrometry from HT-SETD1A isolations from control RNAi-treated and TET2/3 kd cells are indicated below. The full-length HCF1 amino-acid sequence (NP_005325.2) shows the corresponding GlcNAcylated peptides highlighted in yellow with RNAi Ctrl on the left and RNAi TET2/3 kd on the right. (F) Bioluminescence resonance energy transfer (BRET) assays show reduction of SETD1A binding to histone H3.3 in the presence of an OGT inhibitor and in TET2/3 kd cells. Upper diagram showing the schematic of BRET energy transfer upon binding of a NanoLuc-SETD1A fusion donor and fluorescently labelled Histone H3.3-HaloTag fusion acceptor in live HEK293T cells (see Materials and methods for experimental details and calculation of BRET). Left: BRET measurements were calculated without treatment (grey) or with Alloxan treatment (green). Right: BRET measurement for RNAi control (grey) or RNAi TET2/3 (blue). Biological triplicates ±s.d. are shown.
Figure 4
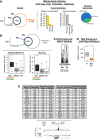
Tet2 knockout mouse tissue shows that Tet2 is needed for global GlcNAcylation and H3K4me3 at target promoters. (A) Genome-wide co-localization of endogenous Tet2 with _O_-GlcNAc and H3K4me3 at promoters and CpG-rich regions. Venn diagrams are shown (_P_-value overlap<10−10) as well as the indicated genome-wide distribution. (B) Tet2, _O_-GlcNAc, and H3K4me3 are enriched at many active genes, mirroring the presence of RNA Pol II. Upper panel: Venn diagram showing the overlap of Tet2 and _O_-GlcNAc with RNA Pol II (_P_-value overlap <10−10); lower panel: Box plots showing the reads density at targets and non-targets (others) for ChIP-Seq RNA Pol II or RNA-Seq in mouse bone marrow. (C) Global decrease in GlcNAcylation is observed in Tet2 knockout mouse bone marrow. Mouse bone marrow tissues with or without a Tet2 knockout were analysed by western blot for _O_-GlcNAc levels using an anti-_O_-GlcNAc antibody. HDAC1 is shown as loading control. (D) ChIP-Seq for H3K4me3 in Tet2 knockout mouse tissues shows reduced global H3K4me3 at target promoters. Overall impact on H3K4me3 peak significance (−log(_P_-value) of the peaks) between wild-type and Tet2 knockout bone marrow is shown. (E) Table showing key haematopoietic genes with specifically reduced H3K4me3 in Tet2 knockout as compared to wild type. The location at CpG islands and the promoter class for each is listed. Lower part: example of H3K4me3 ChIP-Seq profiles (UCSC tracks) in wild type versus Tet2 knockout.
Figure 5
Model connecting DNA modifying enzymes, TETs, a master cellular sensor protein, OGT, and a histone modifying complex, SET1/COMPASS. Based on our findings, a hierarchical model of the involved proteins, with the cascade of their respective activities, can be envisaged as followed: (1) The first sequence of events in the cascade is the formation of TET2/3–OGT interaction, which promotes OGT GlcNAcylation on numerous proteins, including HCF1; (2) In a TET-dependent manner, a GlcNAcylated HCF1 is important for the formation of the SET1/COMPASS; (3) In the last step, both TET proteins and OGT activity favour binding of SETD1A to chromatin, an event necessary for histone H3K4me3 and subsequent transcriptional activation.
Comment in
- O-GlcNAcylation and 5-methylcytosine oxidation: an unexpected association between OGT and TETs.
Balasubramani A, Rao A. Balasubramani A, et al. Mol Cell. 2013 Feb 21;49(4):618-9. doi: 10.1016/j.molcel.2013.02.006. Mol Cell. 2013. PMID: 23438858 Free PMC article.
Similar articles
- TET2 promotes histone O-GlcNAcylation during gene transcription.
Chen Q, Chen Y, Bian C, Fujiki R, Yu X. Chen Q, et al. Nature. 2013 Jan 24;493(7433):561-4. doi: 10.1038/nature11742. Epub 2012 Dec 9. Nature. 2013. PMID: 23222540 Free PMC article. - Differential regulation of the ten-eleven translocation (TET) family of dioxygenases by O-linked β-N-acetylglucosamine transferase (OGT).
Zhang Q, Liu X, Gao W, Li P, Hou J, Li J, Wong J. Zhang Q, et al. J Biol Chem. 2014 Feb 28;289(9):5986-96. doi: 10.1074/jbc.M113.524140. Epub 2014 Jan 6. J Biol Chem. 2014. PMID: 24394411 Free PMC article. - PROSER1 mediates TET2 O-GlcNAcylation to regulate DNA demethylation on UTX-dependent enhancers and CpG islands.
Wang X, Rosikiewicz W, Sedkov Y, Martinez T, Hansen BS, Schreiner P, Christensen J, Xu B, Pruett-Miller SM, Helin K, Herz HM. Wang X, et al. Life Sci Alliance. 2021 Oct 19;5(1):e202101228. doi: 10.26508/lsa.202101228. Print 2022 Jan. Life Sci Alliance. 2021. PMID: 34667079 Free PMC article. - [TET proteins and epigenetic modifications in cancers].
Ciesielski P, Jóźwiak P, Krześlak A. Ciesielski P, et al. Postepy Hig Med Dosw (Online). 2015 Dec 16;69:1371-83. doi: 10.5604/17322693.1186346. Postepy Hig Med Dosw (Online). 2015. PMID: 26671928 Review. Polish. - Mechanisms that regulate the activities of TET proteins.
Joshi K, Liu S, Breslin S J P, Zhang J. Joshi K, et al. Cell Mol Life Sci. 2022 Jun 15;79(7):363. doi: 10.1007/s00018-022-04396-x. Cell Mol Life Sci. 2022. PMID: 35705880 Free PMC article. Review.
Cited by
- Interaction of DNA demethylase and histone methyltransferase upregulates Nrf2 in 5-fluorouracil-resistant colon cancer cells.
Kang KA, Piao MJ, Ryu YS, Kang HK, Chang WY, Keum YS, Hyun JW. Kang KA, et al. Oncotarget. 2016 Jun 28;7(26):40594-40620. doi: 10.18632/oncotarget.9745. Oncotarget. 2016. PMID: 27259240 Free PMC article. - Structure and Function of TET Enzymes.
Yin X, Hu L, Xu Y. Yin X, et al. Adv Exp Med Biol. 2022;1389:239-267. doi: 10.1007/978-3-031-11454-0_10. Adv Exp Med Biol. 2022. PMID: 36350513 - Roles of Histone Deacetylases and Inhibitors in Anticancer Therapy.
Verza FA, Das U, Fachin AL, Dimmock JR, Marins M. Verza FA, et al. Cancers (Basel). 2020 Jun 23;12(6):1664. doi: 10.3390/cancers12061664. Cancers (Basel). 2020. PMID: 32585896 Free PMC article. Review. - Auto-suppression of Tet dioxygenases protects the mouse oocyte genome from oxidative demethylation.
Zhang XJ, Han BB, Shao ZY, Yan R, Gao J, Liu T, Jin ZY, Lai W, Xu ZM, Wang CH, Zhang F, Gu C, Wang Y, Wang H, Walsh CP, Guo F, Xu GL, Du YR. Zhang XJ, et al. Nat Struct Mol Biol. 2024 Jan;31(1):42-53. doi: 10.1038/s41594-023-01125-1. Epub 2024 Jan 4. Nat Struct Mol Biol. 2024. PMID: 38177668 - A Green Light to Switch on Genes: Revisiting Trithorax on Plants.
Ornelas-Ayala D, Cortés-Quiñones C, Olvera-Herrera J, García-Ponce B, Garay-Arroyo A, Álvarez-Buylla ER, Sanchez MP. Ornelas-Ayala D, et al. Plants (Basel). 2022 Dec 23;12(1):75. doi: 10.3390/plants12010075. Plants (Basel). 2022. PMID: 36616203 Free PMC article. Review.
References
- Capotosti F, Guernier S, Lammers F, Waridel P, Cai Y, Jin J, Conaway JW, Conaway RC, Herr W (2011) O-GlcNAc transferase catalyzes site-specific proteolysis of HCF-1. Cell 144: 376–388 - PubMed
- Cedar H, Bergman Y (2009) Linking DNA methylation and histone modification: patterns and paradigms. Nat Rev Genet 10: 295–304 - PubMed
- Daniels DL, Mendez J, Mosley AL, Ramisetty SR, Murphy N, Benink H, Wood KV, Urh M, Washburn MP (2012) Examining the complexity of human RNA polymerase complexes using HaloTag technology coupled to label free quantitative proteomics. J Proteome Res 11: 564–575 - PubMed
- Ficz G, Branco MR, Seisenberger S, Santos F, Krueger F, Hore TA, Marques CJ, Andrews S, Reik W (2011) Dynamic regulation of 5-hydroxymethylcytosine in mouse ES cells and during differentiation. Nature 473: 398–402 - PubMed
Publication types
MeSH terms
Substances
LinkOut - more resources
Full Text Sources
Other Literature Sources
Molecular Biology Databases
Miscellaneous


