CD8+ tumor-infiltrating T cells are trapped in the tumor-dendritic cell network - PubMed (original) (raw)
CD8+ tumor-infiltrating T cells are trapped in the tumor-dendritic cell network
Alexandre Boissonnas et al. Neoplasia. 2013 Jan.
Abstract
Chemotherapy enhances the antitumor adaptive immune T cell response, but the immunosuppressive tumor environment often dominates, resulting in cancer relapse. Antigen-presenting cells such as tumor-associated macrophages (TAMs) and tumor dendritic cells (TuDCs) are the main protagonists of tumor-infiltrating lymphocyte (TIL) immunosuppression. TAMs have been widely investigated and are associated with poor prognosis, but the immunosuppressive activity of TuDCs is less well understood. We performed two-photon imaging of the tumor tissue to examine the spatiotemporal interactions between TILs and TuDCs after chemotherapy. In a strongly immunosuppressive murine tumor model, cyclophosphamide-mediated chemotherapy transiently enhanced the antitumor activity of adoptively transferred ovalbumin-specific CD8(+) T cell receptor transgenic T cells (OTI) but barely affected TuDC compartment within the tumor. Time lapse imaging of living tumor tissue showed that TuDCs are organized as a mesh with dynamic interconnections. Once infiltrated into the tumor parenchyma, OTI T cells make antigen-specific and long-lasting contacts with TuDCs. Extensive analysis of TIL infiltration on histologic section revealed that after chemotherapy the majority of OTI T cells interact with TuDCs and that infiltration is restricted to TuDC-rich areas. We propose that the TuDC network exerts antigen-dependent unproductive retention that trap T cells and limit their antitumor effectiveness.
Figures
Figure 1
Chemotherapy increases TIL infiltration but transiently controls tumor growth. (A) MCA-OVA tumor cells were inoculated in the flank of C57Bl6 mice and tumor growth was monitored. Intraperitoneal injection of CP (100 mg/kg) was performed at day 7 and naïve OTI T cells were adoptively transferred at day 10. Graphs represent mean ± SEM tumor volume of 15 to 20 mice in each group pooled from four independent experiments. (B) Graph represents percent change in tumor growth determined by normalizing to Ctrl values, the fold increase of tumor volume during the indicated periods. Statistical analyses (ANOVA and Bonferroni post t test) were performed on raw data. (C–D) Graphs represent percent and absolute number of CD45.1 OTI T cells (C) and IFN-γ-producing CD45.1 OTI T cells (D) within the tumor. Bars represent mean ± SEM from at least five mice of two to four independent experiments.
Figure 2
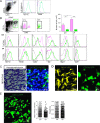
CP treatment barely affects the TuDC network within the tumor parenchyma. (A) Representative overlay histogram plot of CD11c and F4/80 expression gated on CD11b+Ly6G- myeloid cells within the MCA-OVA tumors, 7 days after CP treatment (blue) or without treatment (green). Isotype staining is represented (purple). (B) Comparative multiparametric flow cytometric analysis of CD45+CD11b+YFP- (TAMs, pink) and CD45+CD11b+YFP+ cells (TuDCs, green) from MCA-OVA tumors, 10 days after CP treatment or not. Bars represent the number of indicated cell populations (bars represent mean ± SEM from 9 to 16 mice of three independent experiments). (C) Representative hematoxylin/eosin staining (left) and fluorescent image (right) of frozen MCA-OVA tumor section from CD11c-YFP transgenic tumor-bearing mice. (D) Representative TPLSM images of an explanted MCA-OVA tumor transiently transfected with a YFP-encoding plasmid (left) and an MCA-OVA tumor inoculated in a CD11c-YFP transgenic mouse (right). (E) Volume rendering image (Movie W1) of an MCA-OVA tumor from a CD11c-YFP mouse. Graphs represent the quantification of YFP+ velocity and straightness, 10 days after CP treatment or not. Red bar represents the median (n = 822 and n = 547 for Ctrl and CP-treated mice pooled from at least two independent experiments).
Figure 3
OTI T cells make Ag-dependent interactions with TuDCs. (A) Representative TPLSM images of OTI T cells (cyan) and YFP+ stromal cells (green) within an MCA tumor and an MCA-OVA tumor, 4 days after OTI-CFP T cell adoptive transfer in a CP-treated CD11c-YFP-transgenic mouse. Track paths of OTI T cell moving at the indicated mean velocity are shown colored according to the time of imaging (color-coded time bar is shown). (B) Quantification of OTI T cell arrest coefficient (MCA Ctrl, n = 137; CP, n = 419 and MCAOVA Ctrl, n = 271; CP, n = 920). Mann-Whitney statistical significances are indicated (upper right). (C) Volume rendering reconstitution image shows three representative OTI T cells colored according to the type of interaction performed with YFP+ cells. OTI T cell track paths are represented in white. (D) Quantification of the relative frequency of the three types of OTI T cell/YFP+ cell interactions. Bars represent mean ± SD of the relative frequency of the three types of interactions in each movie (three to four different movies have been evaluated for each condition). Total numbers of OTI T cell characterized are indicated.
Figure 4
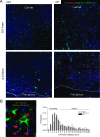
The proportion of TILs contacting TuDCs is enhanced after chemotherapy. OTI-DsRed T cells were adoptively transferred into CD11c-YFP transgenic mice bearing MCA-OVA tumor treated or not with CP. Seven days after adoptive transfer, tumors were carefully orientated and sectioned to define the periphery and the center of the tumor. (A) Representative tumor sections are shown and the distance from the periphery is indicated. OTI T cells are red, YFP+ cells are green, and tumor parenchyma is stained by DAPI (blue). (B) Representative examples of the OTI T cell/YFP+ distance measurement (white bars) between the center of the T cell and its proximal YFP+ cell. Graph represents the frequency distribution of the distances (right). Mean radius of OTI T cell is 5 _µ_m, and conjugates with a distance less than 5 _µ_m are considered as contacting cells [n = 304 OTI cells for Ctrl (white bars) and n = 880 OTI cells for CP-treated mice (black bars) pooled from two to three different tumors].
Figure 5
TIL infiltration is stopped in TuDC-rich areas. (A) TPLSM image showing collagen fibers (blue), YFP+ cells (green), and OTI T cells (red) in the peripheral area of an MCA-OVA tumor from a CP-treated mouse. Representative track paths of OTI T cell with a straightness of >0.5 are indicated in purple and those with a straightness of <0.5 are in white. (B) TPLSM image after DAPI injection (cyan). Representative track paths of OTI T cell in DAPI-rich area are indicated in purple and those in TuDC-rich area are in white. (C) Graphs represent the quantification of OTI T cell velocity, straightness, and arrest coefficient, 7 days after OTI T cell adoptive transfer in CP-treated mice (data are pooled from at least three independent experiments). Red bar represents the mean. Mann-Whitney statistical significances are indicated.
Figure 6
TILs are trapped in TuDC network. OTI T cell and YFP+ cell densities were quantified by histologic analysis 7 days after adoptive transfer of OTI-DsRed T cell into CD11c-YFP transgenic mice bearing MCA-OVA tumors treated with CP. (A) The image illustrates cell densities in 250-_µ_m2 fields (white square) after volume rendering. White squares were located by area with homogenous distribution of OTI T cells. (B) Each dot represents the density of OTI T cells as a function of the density of TuDCs. The numbers of red and green cells were determined automatically in 75 different fields from more than 20 images taken serially from the periphery to the center of the tumor, of three different tumors. Red line represents the linear regression. Spearman r and P value are indicated.
Similar articles
- Combined immunostimulatory monoclonal antibodies extend survival in an aggressive transgenic hepatocellular carcinoma mouse model.
Morales-Kastresana A, Sanmamed MF, Rodriguez I, Palazon A, Martinez-Forero I, Labiano S, Hervas-Stubbs S, Sangro B, Ochoa C, Rouzaut A, Azpilikueta A, Bolaños E, Jure-Kunkel M, Gütgemann I, Melero I. Morales-Kastresana A, et al. Clin Cancer Res. 2013 Nov 15;19(22):6151-62. doi: 10.1158/1078-0432.CCR-13-1189. Epub 2013 Sep 12. Clin Cancer Res. 2013. PMID: 24030703 - Cutting edge: delay and reversal of T cell tolerance by intratumoral injection of antigen-loaded dendritic cells in an autochthonous tumor model.
Higham EM, Shen CH, Wittrup KD, Chen J. Higham EM, et al. J Immunol. 2010 Jun 1;184(11):5954-8. doi: 10.4049/jimmunol.1000265. Epub 2010 Apr 28. J Immunol. 2010. PMID: 20427765 Free PMC article. - Melanoma-infiltrating dendritic cells induce protective antitumor responses mediated by T cells.
Preynat-Seauve O, Contassot E, Schuler P, French LE, Huard B. Preynat-Seauve O, et al. Melanoma Res. 2007 Jun;17(3):169-76. doi: 10.1097/CMR.0b013e3281844531. Melanoma Res. 2007. PMID: 17505262 - Inhibition of melanoma growth after treatment with dendritic cells in a Tyr-SV40E murine model requires CD4+ T cells but not CD8+ T cells.
Milling SW, Sai T, Silvers WK, Mintz B. Milling SW, et al. Melanoma Res. 2004 Dec;14(6):555-62. doi: 10.1097/00008390-200412000-00019. Melanoma Res. 2004. PMID: 15577330 - Loss of CTL function among high-avidity tumor-specific CD8+ T cells following tumor infiltration.
Janicki CN, Jenkinson SR, Williams NA, Morgan DJ. Janicki CN, et al. Cancer Res. 2008 Apr 15;68(8):2993-3000. doi: 10.1158/0008-5472.CAN-07-5008. Cancer Res. 2008. PMID: 18413769
Cited by
- Intravital imaging of the functions of immune cells in the tumor microenvironment during immunotherapy.
Peng X, Wang Y, Zhang J, Zhang Z, Qi S. Peng X, et al. Front Immunol. 2023 Dec 6;14:1288273. doi: 10.3389/fimmu.2023.1288273. eCollection 2023. Front Immunol. 2023. PMID: 38124754 Free PMC article. Review. - Intravital multiphoton imaging of cutaneous immune responses.
Kabashima K, Egawa G. Kabashima K, et al. J Invest Dermatol. 2014 Nov;134(11):2680-2684. doi: 10.1038/jid.2014.225. Epub 2014 Jun 26. J Invest Dermatol. 2014. PMID: 24965543 - Vaccine-induced tumor regression requires a dynamic cooperation between T cells and myeloid cells at the tumor site.
Thoreau M, Penny HL, Tan K, Regnier F, Weiss JM, Lee B, Johannes L, Dransart E, Le Bon A, Abastado JP, Tartour E, Trautmann A, Bercovici N. Thoreau M, et al. Oncotarget. 2015 Sep 29;6(29):27832-46. doi: 10.18632/oncotarget.4940. Oncotarget. 2015. PMID: 26337837 Free PMC article. - Monitoring Immune Cell Function Through Optical Imaging: a Review Highlighting Transgenic Mouse Models.
Chawda C, McMorrow R, Gaspar N, Zambito G, Mezzanotte L. Chawda C, et al. Mol Imaging Biol. 2022 Apr;24(2):250-263. doi: 10.1007/s11307-021-01662-5. Epub 2021 Nov 4. Mol Imaging Biol. 2022. PMID: 34735680 Free PMC article. Review. - Innovative optical imaging strategies for monitoring immunotherapy in the tumor microenvironments.
Um-E-Kalsoom, Wang S, Qu J, Liu L. Um-E-Kalsoom, et al. Cancer Med. 2024 Oct;13(19):e70155. doi: 10.1002/cam4.70155. Cancer Med. 2024. PMID: 39387259 Free PMC article. Review.
References
- Apetoh L, Ghiringhelli F, Tesniere A, Obeid M, Ortiz C, Criollo A, Mignot G, Maiuri MC, Ullrich E, Saulnier P, et al. Toll-like receptor 4-dependent contribution of the immune system to anticancer chemotherapy and radiotherapy. Nat Med. 2007;13:1050–1059. - PubMed
- Ghiringhelli F, Apetoh L, Housseau F, Kroemer G, Zitvogel L. Links between innate and cognate tumor immunity. Curr Opin Immunol. 2007;19:224–231. - PubMed
Publication types
MeSH terms
Substances
LinkOut - more resources
Full Text Sources
Other Literature Sources
Research Materials


