TSLP elicits IL-33-independent innate lymphoid cell responses to promote skin inflammation - PubMed (original) (raw)
TSLP elicits IL-33-independent innate lymphoid cell responses to promote skin inflammation
Brian S Kim et al. Sci Transl Med. 2013.
Abstract
Innate lymphoid cells (ILCs) are a recently identified family of heterogeneous immune cells that can be divided into three groups based on their differential developmental requirements and expression of effector cytokines. Among these, group 2 ILCs produce the type 2 cytokines interleukin-5 (IL-5) and IL-13 and promote type 2 inflammation in the lung and intestine. However, whether group 2 ILCs reside in the skin and contribute to skin inflammation has not been characterized. We identify a population of skin-resident group 2 ILCs present in healthy human skin that are enriched in lesional human skin from atopic dermatitis (AD) patients. Group 2 ILCs were also found in normal murine skin and were critical for the development of inflammation in a murine model of AD-like disease. Remarkably, in contrast to group 2 ILC responses in the intestine and lung, which are critically regulated by IL-33 and IL-25, group 2 ILC responses in the skin and skin-draining lymph nodes were independent of these canonical cytokines but were critically dependent on thymic stromal lymphopoietin (TSLP). Collectively, these results demonstrate an essential role for IL-33- and IL-25-independent group 2 ILCs in promoting skin inflammation.
Figures
Fig. 1
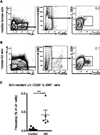
Group 2 ILCs are present in healthy human skin and are enriched in human AD skin lesions. (A) Identification of skin-resident ILCs in healthy human control skin by flow cytometry as lineage (Lin)–negative FcεRIα− CD25+ IL-33R+ cells. Data from human control skin tissue are representative of 9 healthy control subjects. (B) Identification of skin-resident ILCs in human AD skin by flow cytometry as Lin− FcεRIα− CD25+ IL-33R+ cells. Data from human lesional AD skin are representative of 5 AD patients. (C) Frequencies of Lin− FcεRIα− CD25+ IL-33R+ cells from normal skin of healthy controls and lesional skin from AD patients. All cell frequencies are given as a percentage of total Lin− cells. ***P<0.001, Student’s t test.
Fig. 2
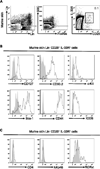
Skin-resident group 2 ILCs are present in murine skin. (A) Identification of skin-resident ILCs in C57BL/6 wild-type (WT) mice by flow cytometry as Lin− FcεRIα− CD25+ IL-33R+ cells. All cell frequencies are given as a percentage of total Lin− cells. SSC, side scatter. (B) Expression of cell surface markers on Lin− CD25+ IL-33R+ murine skin-resident ILCs (solid black line) compared to fluorescence minus one controls (FMO; gray-shaded). (C) Expression of cell surface markers and RORγt-GFP on Lin− CD25+ IL-33R+ murine skin-resident ILCs from BAC-transgenic Rorc(γt)-GfpTG mice. Data from murine skin tissue are representative of more than 5 independent experiments, n = 3−4 mice per group per experiment.
Fig. 3
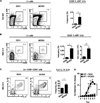
Skin-resident group 2 ILCs are enriched in a mouse model of AD-like inflammation. C57BL/6 WT mice were treated with vehicle control (EtOH) or MC903. (A) Representative flow cytometry plots and frequencies of Lin− CD25+ IL-33R+ ILCs from ear skin. (B) Representative flow cytometry plots, frequencies, and absolute cell numbers of Lin− CD25+ IL-33R+ ILCs from the skin dLNs. (C) Representative flow cytometry plots and frequencies of IL-5+ IL-13+ ILCs from the skin dLNs of treated mice that were also stimulated with PMA/ionomycin. Flow cytometry plots are gated on Lin− CD25+ CD90+ cells. (D) Ear thickness measurements. All data are from Day 7 of treatment and are representative of more than three independent experiments, n = 3−4 mice per group per experiment. Cell frequencies in A and B are given as a percentage of total Lin− cells. All statistical analyses of ear thickness measurements were performed on Day 7. *P<0.05, **P<0.01, ***P<0.001, Student’s t test.
Fig. 4
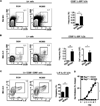
Skin-resident group 2 ILCs are enriched in AD-like inflammation independent of adaptive immunity. Rag1−/− mice were treated with vehicle control (EtOH) or MC903. (A) Representative flow cytometry plots and frequencies of Lin− CD25+ IL-33R+ ILCs from Rag1−/− ear skin. (B) Representative flow cytometry plots, frequencies, and absolute cell numbers of Lin− CD25+ IL-33R+ ILCs from the skin dLNs. (C) Representative flow cytometry plots and frequencies of IL-5+ IL-13+ ILCs from the skin dLNs of treated mice also stimulated with PMA/ionomycin. Flow cytometry plots are gated on Lin− CD25+ CD90+ cells. (D) Ear thickness measurements. All data are from Day 7 of treatment and are representative of more than 3 experiments, n = 3−4 mice per group per experiment. Cell frequencies in A and B are given as a percentage of total Lin− cells. All statistical analyses of ear thickness measurements were performed on Day 7. *P<0.05, **P<0.01, Student’s t test.
Fig. 5
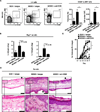
Depletion of ILCs attenuates AD-like dermatitis and type 2 cytokine responses in the skin. Rag1−/− mice were treated with vehicle control (EtOH) + isotype mAb, MC903 + isotype mAb, or MC903 + anti-CD25 mAb. (A) Representative flow cytometry plots, frequencies, and absolute cell numbers of Lin− CD25+ IL-33R+ ILCs from the skin dLNs of Rag1−/− mice. Cell frequencies are given as a percentage of total Lin− cells. (B) IL-5 and IL-13 cytokine levels from ear skin homogenates, measured by ELISA. (C) Ear thickness measurements. (D) H&E staining of ear skin tissue. Closed black arrows indicate orthokeratosis, closed gray arrows indicate acanthosis, open green arrows indicate mononuclear leukocytes, open black arrows indicate granulocytes. Scale bar, 100 µm for the upper panel; 25 µm for the lower panel. All data in (A, B and D) are from Day 7 of treatment and are representative of more than 4 experiments, n = 3−4 mice per group per experiment. All statistical analyses of ear thickness measurements were performed on Day 7. *P<0.05, Student’s t test.
Fig. 6
IL-33 is dispensable for the elicitation of skin-associated group 2 ILC responses in the skin. C57BL/6 WT or Il33−/− mice were treated with vehicle control (EtOH) or MC903. (A) Representative flow cytometry plots, frequencies, and absolute cell numbers of Lin− CD25+ IL-33R+ ILCs from the skin dLNs of treated mice. All cell frequencies are given as a percentage of total Lin− cells. (B) Ear thickness measurements. (C) H&E staining of ear skin tissue. Closed black arrows indicate orthokeratosis, closed gray arrows indicate acanthosis, open green arrows indicate mononuclear leukocytes, open black arrows indicate granulocytes. Scale bar, 100 µm for the upper panels; 25 µm for lower panels. All data in A and C are from Day 7 of treatment and are representative of 2 or more experiments, n = 3−4 mice per group per experiment. All statistical analyses of ear thickness measurements were performed on Days 3 and 7.
Fig. 7
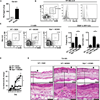
Skin-associated group 2 ILC responses and AD-like dermatitis are critically dependent on TSLP signaling. C57BL/6 WT or Tslpr−/− mice were treated with control (EtOH) or MC903. (A) TSLP cytokine levels from ear skin explants following treatment, as measured by ELISA. N.D., not detected. (B) Representative flow cytometry plots demonstrating expression of TSLPR on Lin− CD25+ IL-33R+ cells from skin dLNs of C57BL/6 WT mice (solid black line) compared to Tslpr−/− mice (gray-shaded) and expression of CD127 (solid black line) on Lin− CD25+ IL-33R+ cells compared to FMO controls (gray shaded). (C) Representative flow cytometry plots, frequencies, and absolute cell numbers of skin dLN Lin− CD25+ IL-33R+ ILCs in C57BL/6 WT and Tslpr−/− mice. All cell frequencies are given as a percentage of total Lin− cells. (D) Ear thickness measurements. (E) H&E staining of skin tissue. Closed black arrows indicate orthokeratosis, closed gray arrows indicate acanthosis, open green arrows indicate mononuclear leukocytes, open black arrows indicate granulocytes. Scale bars, 100 µm for the upper panels; 25 µm for the lower panels. All data in A, B, C and E are from Day 7 of treatment and are representative 3 or more experiments, n = 3−4 mice per group per experiment. All statistical analyses of ear thickness measurements were performed on Day 7. *P<0.05, Student’s t test.
Fig. 8
TSLP elicits group 2 ILC responses independently of IL-33 signaling. C57BL/6 WT or Il33−/− mice were treated with control cDNA plasmid or TSLP cDNA plasmid. (A) Representative flow cytometry plots, frequencies, and absolute cell numbers of skin dLN Lin− CD25+ IL-33R+ ILCs from WT mice taken 3 weeks after treatment. (B) Representative flow cytometry plots, frequencies, and absolute cell numbers of skin dLN Lin− CD25+ IL-33R+ ILCs from Il33−/− mice taken 3 weeks after treatment. All cell frequencies are given as a percentage of total Lin− cells. All data are representative of 2 or more experiments, n = 3−4 mice per group per experiment. *P<0.05, **P<0.01, Student’s t test.
Similar articles
- HPV16 E7 expression in skin induces TSLP secretion, type 2 ILC infiltration and atopic dermatitis-like lesions.
Bergot AS, Monnet N, Le Tran S, Mittal D, Al-Kouba J, Steptoe RJ, Grimbaldeston MA, Frazer IH, Wells JW. Bergot AS, et al. Immunol Cell Biol. 2015 Jul;93(6):540-7. doi: 10.1038/icb.2014.123. Epub 2015 Jan 20. Immunol Cell Biol. 2015. PMID: 25601274 Free PMC article. - Topical application of celastrol alleviates atopic dermatitis symptoms mediated through the regulation of thymic stromal lymphopoietin and group 2 innate lymphoid cells.
Lee JK, Seok JK, Cho I, Yang G, Kim KB, Kwack SJ, Kang HC, Cho YY, Lee HS, Lee JY. Lee JK, et al. J Toxicol Environ Health A. 2021 Nov 17;84(22):922-931. doi: 10.1080/15287394.2021.1955785. Epub 2021 Jul 25. J Toxicol Environ Health A. 2021. PMID: 34304725 - Skin-specific expression of IL-33 activates group 2 innate lymphoid cells and elicits atopic dermatitis-like inflammation in mice.
Imai Y, Yasuda K, Sakaguchi Y, Haneda T, Mizutani H, Yoshimoto T, Nakanishi K, Yamanishi K. Imai Y, et al. Proc Natl Acad Sci U S A. 2013 Aug 20;110(34):13921-6. doi: 10.1073/pnas.1307321110. Epub 2013 Aug 5. Proc Natl Acad Sci U S A. 2013. PMID: 23918359 Free PMC article. - Interleukin-33 in atopic dermatitis.
Imai Y. Imai Y. J Dermatol Sci. 2019 Oct;96(1):2-7. doi: 10.1016/j.jdermsci.2019.08.006. Epub 2019 Aug 19. J Dermatol Sci. 2019. PMID: 31455506 Review. - Interleukin-7 Receptor Alpha in Innate Lymphoid Cells: More Than a Marker.
Sheikh A, Abraham N. Sheikh A, et al. Front Immunol. 2019 Dec 11;10:2897. doi: 10.3389/fimmu.2019.02897. eCollection 2019. Front Immunol. 2019. PMID: 31921158 Free PMC article. Review.
Cited by
- Epidermal Expression and Regulation of Interleukin-33 during Homeostasis and Inflammation: Strong Species Differences.
Sundnes O, Pietka W, Loos T, Sponheim J, Rankin AL, Pflanz S, Bertelsen V, Sitek JC, Hol J, Haraldsen G, Khnykin D. Sundnes O, et al. J Invest Dermatol. 2015 Jul;135(7):1771-1780. doi: 10.1038/jid.2015.85. Epub 2015 Mar 4. J Invest Dermatol. 2015. PMID: 25739051 - Innate lymphoid cells in the initiation, regulation and resolution of inflammation.
Sonnenberg GF, Artis D. Sonnenberg GF, et al. Nat Med. 2015 Jul;21(7):698-708. doi: 10.1038/nm.3892. Epub 2015 Jun 29. Nat Med. 2015. PMID: 26121198 Free PMC article. Review. - Anti-Itching and Anti-Inflammatory Effects of Kushenol F via the Inhibition of TSLP Production.
Jo S, Gong EY, Yoo W, Choi H, Jung D, Noh KH, Kim S, Kim SH, Lee HK. Jo S, et al. Pharmaceuticals (Basel). 2022 Oct 31;15(11):1347. doi: 10.3390/ph15111347. Pharmaceuticals (Basel). 2022. PMID: 36355519 Free PMC article. - The Roles of Innate Immune Cells in Atopic Dermatitis.
Pan Y, Wang Y, Xu M, Zhong M, Peng X, Zeng K, Huang X. Pan Y, et al. J Innate Immun. 2024;16(1):385-396. doi: 10.1159/000539534. Epub 2024 Jul 18. J Innate Immun. 2024. PMID: 39025048 Free PMC article. Review. - Deciphering the transcriptional switches of innate lymphoid cell programming: the right factors at the right time.
Lim AW, McKenzie AN. Lim AW, et al. Genes Immun. 2015 Apr-May;16(3):177-86. doi: 10.1038/gene.2014.83. Epub 2015 Jan 22. Genes Immun. 2015. PMID: 25611557 Free PMC article. Review.
References
- Spits H, Cupedo T. Innate lymphoid cells: emerging insights in development, lineage relationships, and function. Annu Rev Immunol. 2012;30:647. - PubMed
- Spits H, et al. Nature Reviews Immunology. 2013 - PubMed
Publication types
MeSH terms
Substances
Grants and funding
- R01 AI095466/AI/NIAID NIH HHS/United States
- AI061570/AI/NIAID NIH HHS/United States
- AI087990/AI/NIAID NIH HHS/United States
- 2-P30 CA016520/CA/NCI NIH HHS/United States
- 5-P30-AR-057217/AR/NIAMS NIH HHS/United States
- R21 AI083480/AI/NIAID NIH HHS/United States
- U01 AI095608/AI/NIAID NIH HHS/United States
- R01 AI074878/AI/NIAID NIH HHS/United States
- AI085828/AI/NIAID NIH HHS/United States
- P30 DK050306/DK/NIDDK NIH HHS/United States
- T32 AI007532/AI/NIAID NIH HHS/United States
- KL2-RR024132/RR/NCRR NIH HHS/United States
- AI102942/AI/NIAID NIH HHS/United States
- DP5OD012116/OD/NIH HHS/United States
- DP5 OD012116/OD/NIH HHS/United States
- F32 AI085828/AI/NIAID NIH HHS/United States
- AI074878/AI/NIAID NIH HHS/United States
- T32-AI007532/AI/NIAID NIH HHS/United States
- AI083480/AI/NIAID NIH HHS/United States
- R01 AI102942/AI/NIAID NIH HHS/United States
- R21 AI087990/AI/NIAID NIH HHS/United States
- KL2 RR024132/RR/NCRR NIH HHS/United States
- T32 AR007465/AR/NIAMS NIH HHS/United States
- AI095608/AI/NIAID NIH HHS/United States
- P30 CA016520/CA/NCI NIH HHS/United States
- KL2TR000139/TR/NCATS NIH HHS/United States
- P30-DK050306/DK/NIDDK NIH HHS/United States
- R01 AI061570/AI/NIAID NIH HHS/United States
- P30 AR057217/AR/NIAMS NIH HHS/United States
- R01 AI097333/AI/NIAID NIH HHS/United States
- AI095466/AI/NIAID NIH HHS/United States
- AI097333/AI/NIAID NIH HHS/United States
- KL2 TR000139/TR/NCATS NIH HHS/United States
LinkOut - more resources
Full Text Sources
Other Literature Sources
Molecular Biology Databases
