RNA transfer from poliovirus 135S particles across membranes is mediated by long umbilical connectors - PubMed (original) (raw)
RNA transfer from poliovirus 135S particles across membranes is mediated by long umbilical connectors
Mike Strauss et al. J Virol. 2013 Apr.
Abstract
During infection, the binding of poliovirus to its cell surface receptor at 37°C triggers an expansion of the virus in which internal polypeptides that bind to membranes are externalized. Subsequently, in a poorly understood process, the viral RNA genome is transferred directly across an endosomal membrane, and into the host cell cytoplasm, to initiate infection. Here, cryoelectron tomography demonstrates the results of 37°C warming of a poliovirus-receptor-liposome model complex that was produced using Ni-nitrilotriacetic acid lipids and His-tagged receptor ectodomains. In total, 651 subtomographic volumes were aligned, classified, and averaged to obtain detailed pictures, showing both the conversion of virus into its expanded form and the passage of RNA into intact liposomes. Unexpectedly, the virus and membrane surfaces were located ∼50 Å apart, with the 5-fold axis tilted away from the perpendicular, and the solvent spaces between them were spanned by either one or two long "umbilical" density features that lie at an angle to the virus and membrane. The thinner connector, which sometimes appears alone, is 28 to 30 Å in diameter and has a footprint on the virus surface located close to either a 5-fold or a 3-fold axis. The broader connector has a footprint near the quasi-3-fold hole that opens upon virus expansion and is hypothesized to include RNA, shielded from enzymatic degradation by polypeptides that include the N-terminal extension of VP1 and capsid protein VP4. The implications of these observations for the mechanism of RNase-protected RNA transfer in picornaviruses are discussed.
Figures
Fig 1
Virus structure. (A) Virion (left) and ribbon diagram of biological protomer (right; VP1, blue; VP2, yellow; VP3, red; VP4, green). (B) Schematic of the generalized beta-barrel representation of VP1, VP2, and VP3 with the individual strands identified by letters. Loops are identified by the two beta strands that they connect (e.g., the BC loop of VP1 connects the B and C strands). (C) Internal network of intertwined VP4 and N-terminal polypeptides. (D) Channel at 5-fold axis. Numbers represent icosahedral symmetry axes.
Fig 2
Tomographic reconstruction showing expanded poliovirions bound directly to liposomes. (A) Large field of view showing an 80-Å-thick slice perpendicular to the electron beam. Scale bar, 1,000 Å. (B) Gallery of individual subtomograms, oriented so that the membrane contact direction lies in the plane of the page. (C) Virion appearing to be partially engulfed by membrane. (D) Virions appearing to extrude RNA (arrow) through a membrane. (E) A single subtomogram with a visible connection point. (F) “Membrane contact vectors” were established visually, in three dimensions, by identifying the coordinates of virus centers (white circle) and nearby membrane contact points (black circle). Scale bar (B to F), 500 Å.
Fig 3
Orientation of subtomograms for symmetric and subsequent asymmetric averaging. (A) An icosahedral average of 651 oriented subtomograms has large outward projections at each 5-fold and 3-fold axis and S-shaped depressions or holes across each 2-fold axis. These are characteristic features of expanded virions and show that the subtomograms are well aligned. (B) The icosahedral 5-3-3 triangle and (C) the 5-2-3-2 quadrilateral are diagrammed in gray. These two areas, with symmetry axes at the corners, are two alternative choices for the icosahedrally unique 1/60 portion of the virus surface. Pentagons, triangles, and lens shapes indicate 5-fold, 3-fold, and 2-fold axes, respectively. (B) Purple and yellow patches, respectively, indicate the footprints of bound poliovirus receptor (7) and extruded RNA molecules, as previously seen in asymmetric reconstructions of expanded virions “caught in the-act” of extruding RNA (32). In the present experiment, particles were aligned with one another by choosing 1 of 60 icosahedrally equivalent orientations that would bring the membrane contact vector (as defined by the white and black circles in Fig. 2F) as close as possible to the center of the 5-3-3 triangle or the center of the 5-2-3-2 quadrilateral. Possible density artifacts near plane-figure boundaries were avoided by calculating every map in a way that features of interest were located near the center of the selected region.
Fig 4
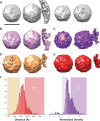
Averages of subtomograms. Scale bar, 300 Å. For each class average, two orthogonal views are shown: In the face-on view, which is intended to show umbilicus locations on the capsid surface within the icosahedral triangle, the contour level was chosen with UCSF Chimera (46) so that the capsid exterior is shown as a mostly continuous solid surface and clipping planes section the umbilicus (hatched areas). The side view (rotated 90° about a vertical axis), with the membrane contact lying to the right of the virus, is clipped to make the umbilical connection between the virus and membrane as clear as possible, when it is present. To aid interpretability, two adjoining copies of the icosahedral 5-3-3 triangle are included. Prior to the calculation of each map, two possibly different icosahedral operators were applied to each subtomogram, one intended to rotate its membrane contact vector as close as possible to the center of the 5-3-3 triangle and the other intended to rotate its membrane contact vector as close as possible to the center of the 5-2-3-2 quadrilateral. To reduce calculation artifacts, we display the view that places the umbilical connection as far as possible from the edges of the plane figure. (A) The class average includes all 651 oriented subtomograms. Note that umbilicus locations (hatched areas) along the shoulder of the 5-fold axis and near the center of the 5-3-3 triangle are prevalent in the population. The third image from the left shows the unique hole in the capsid that appears at a higher contour level. The fourth image shows the locations of the umbilical features, relative to the position of the hole (red footprint), in the context of the icosahedral 5-3-3 triangle. (B, C) Density averages resulting from classification by particle “emptiness,” as measured by the ratio of solvent-corrected densities in the interior to those in the capsid. The least dense tertile of the population is averaged on the left (B), and the densest tertile is averaged on the right (C). Observe that visible umbilici are present in “fuller” particles but absent from “emptier” ones. (D, E) Density averages derived from classification by distance from membrane to virus center. The closest quartile (D) is averaged on the left, and the furthest quartile is averaged on the right (E). Note that no umbilicus is visible in the furthest class and no distortion of the membrane is apparent. We take this as an indication that some of the particles located near membranes are not actually attached and as evidence that the umbilicus is real (rather than an artifact of the calculation) when it is present. (F) Histograms show population distributions of virus-to-membrane distance, as measured from the virus center (left), and of density within the RNA region, relative to that in the capsid (right). Background shading indicates the portion of the population that was included in each of the class averages (B to E).
Fig 5
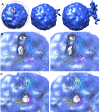
An improved average image results from exclusion of the emptiest and most distant particles. (A) In the average of the “best” 206 particles (having the highest RNA density and a proximate point of contact), the 5-fold and quasi-3-fold umbilici are both present at density levels similar to those of the capsid and membrane (middle). The membrane becomes visible at a lower contour level (right). As in the average of 651 images, the 5-fold axis of the virus is tilted, relative to the plane of the membrane. In contrast, the membrane is the expected width for a bilayer, which suggests a more conformationally homogeneous population. In panel A, crosshatching of the clipped umbilicus indicates density higher than that of the isocontour. Icosahedral symmetry elements are shown. Panels B and C are stereo views, without hatching, showing the 80S pseudoatomic model superimposed on the 206-particle map. In panel B, the atomic model helps to identify the positions of the umbilici on the virus surface. Note that the quasi-3-fold umbilicus is located above the “canyon,” midway between the 5-fold mesa and the propeller tip. (C) At a higher threshold, the unique hole in the capsid becomes visible, with Gln-68 of VP1 lying just below it (green ball).
Fig 6
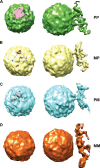
A biased reclassification scheme was applied to the 309 nonempty, nondistant particles. Subtomograms were classified into four groups, based on whether their 5-fold and quasi-3-fold umbilici had density levels above or below the density of the capsid. (Left) Sections through the reconstructions (hatched areas) show the shape, size, and location of the umbilical features within the icosahedral triangle in face-on views. (Right) Corresponding side views. Panels: A, the PP class; B, the MP class; C, the PM class; D, the MM class. (A) The PP class average shows that particles with both 5-fold and quasi-3-fold umbilici must exist in the population. (B) The MP class average, with a strong 5-fold umbilicus but a weak quasi-3-fold umbilicus, shows strong, tubular density for the 5-fold umbilicus, 25 by 30 Å in cross-section and about 55 to 60 Å long. Note that the hole in the capsid near the unique quasi-3-fold axis is present at the same contour level as the umbilicus. This class demonstrates the possibility of the 5-fold umbilicus existing alone, in the absence of a quasi-3-fold umbilicus. (C) The PM class average, with a weak 5-fold umbilicus and a strong quasi-3-fold umbilicus, unexpectedly, shows umbilical density near the icosahedral 3-fold axis. This class suggests the possibility that the quasi-3-fold umbilicus cannot exist unless a second umbilicus is also present. In the text, the hypothesis is discussed that the quasi-3-fold umbilicus includes viral RNA but the 5- and 3-fold umbilici do not, self-assembling from multiple copies of VP4 and N termini of VP1. (D) The MM class average, unsurprisingly, shows no evidence of a connection and may include particles that are near membrane but not attached.
Similar articles
- Nectin-like interactions between poliovirus and its receptor trigger conformational changes associated with cell entry.
Strauss M, Filman DJ, Belnap DM, Cheng N, Noel RT, Hogle JM. Strauss M, et al. J Virol. 2015 Apr;89(8):4143-57. doi: 10.1128/JVI.03101-14. Epub 2015 Jan 28. J Virol. 2015. PMID: 25631086 Free PMC article. - Characterization of early steps in the poliovirus infection process: receptor-decorated liposomes induce conversion of the virus to membrane-anchored entry-intermediate particles.
Tuthill TJ, Bubeck D, Rowlands DJ, Hogle JM. Tuthill TJ, et al. J Virol. 2006 Jan;80(1):172-80. doi: 10.1128/JVI.80.1.172-180.2006. J Virol. 2006. PMID: 16352541 Free PMC article. - Cryo-electron microscopy reconstruction shows poliovirus 135S particles poised for membrane interaction and RNA release.
Butan C, Filman DJ, Hogle JM. Butan C, et al. J Virol. 2014 Feb;88(3):1758-70. doi: 10.1128/JVI.01949-13. Epub 2013 Nov 20. J Virol. 2014. PMID: 24257617 Free PMC article. - Molecular biology and cell-free synthesis of poliovirus.
Wimmer E, Nomoto A. Wimmer E, et al. Biologicals. 1993 Dec;21(4):349-56. doi: 10.1006/biol.1993.1095. Biologicals. 1993. PMID: 8024750 Review. - Early events in poliovirus infection: virus-receptor interactions.
Racaniello VR. Racaniello VR. Proc Natl Acad Sci U S A. 1996 Oct 15;93(21):11378-81. doi: 10.1073/pnas.93.21.11378. Proc Natl Acad Sci U S A. 1996. PMID: 8876143 Free PMC article. Review.
Cited by
- Endosome rupture enables enteroviruses from the family Picornaviridae to infect cells.
Ishemgulova A, Mukhamedova L, Trebichalská Z, Rájecká V, Payne P, Šmerdová L, Moravcová J, Hrebík D, Buchta D, Škubník K, Füzik T, Vaňáčová Š, Nováček J, Plevka P. Ishemgulova A, et al. Commun Biol. 2024 Nov 8;7(1):1465. doi: 10.1038/s42003-024-07147-9. Commun Biol. 2024. PMID: 39511383 Free PMC article. - Foot-and-mouth disease virus antigenic landscape and reduced immunogenicity elucidated in atomic detail.
Li H, Liu P, Dong H, Dekker A, Harmsen MM, Guo H, Wang X, Sun S. Li H, et al. Nat Commun. 2024 Oct 10;15(1):8774. doi: 10.1038/s41467-024-53027-5. Nat Commun. 2024. PMID: 39389971 Free PMC article. - Enterovirus-D68 - A Reemerging Non-Polio Enterovirus that Causes Severe Respiratory and Neurological Disease in Children.
Grizer CS, Messacar K, Mattapallil JJ. Grizer CS, et al. Front Virol. 2024;4:1328457. doi: 10.3389/fviro.2024.1328457. Epub 2024 Feb 14. Front Virol. 2024. PMID: 39246649 Free PMC article. - VP2 mediates the release of the feline calicivirus RNA genome by puncturing the endosome membrane of infected cells.
Sun W, Wang M, Shi Z, Wang P, Wang J, Du B, Wang S, Sun Z, Liu Z, Wei L, Yang D, He X, Wang J. Sun W, et al. J Virol. 2024 May 14;98(5):e0035024. doi: 10.1128/jvi.00350-24. Epub 2024 Apr 9. J Virol. 2024. PMID: 38591900 Free PMC article. - The rotavirus VP5*/VP8* conformational transition permeabilizes membranes to Ca2.
de Sautu M, Herrmann T, Scanavachi G, Jenni S, Harrison SC. de Sautu M, et al. PLoS Pathog. 2024 Apr 4;20(4):e1011750. doi: 10.1371/journal.ppat.1011750. eCollection 2024 Apr. PLoS Pathog. 2024. PMID: 38574119 Free PMC article.
References
- Mercer J, Helenius A. 2009. Virus entry by macropinocytosis. Nat. Cell Biol. 11:510–520 - PubMed
- Levy H, Bostina M, Filman DJ, Hogle JM. 2010. Cell entry: a biochemical and structural perspective, p 87–107 In Ehrenfeld E, Domingo E, Roos R. (ed), The picornaviruses. ASM Press, Washington, DC
Publication types
MeSH terms
Substances
LinkOut - more resources
Full Text Sources
Other Literature Sources
Research Materials


