Circulating breast tumor cells exhibit dynamic changes in epithelial and mesenchymal composition - PubMed (original) (raw)
. 2013 Feb 1;339(6119):580-4.
doi: 10.1126/science.1228522.
Aditya Bardia, Ben S Wittner, Shannon L Stott, Malgorzata E Smas, David T Ting, Steven J Isakoff, Jordan C Ciciliano, Marissa N Wells, Ajay M Shah, Kyle F Concannon, Maria C Donaldson, Lecia V Sequist, Elena Brachtel, Dennis Sgroi, Jose Baselga, Sridhar Ramaswamy, Mehmet Toner, Daniel A Haber, Shyamala Maheswaran
Affiliations
- PMID: 23372014
- PMCID: PMC3760262
- DOI: 10.1126/science.1228522
Circulating breast tumor cells exhibit dynamic changes in epithelial and mesenchymal composition
Min Yu et al. Science. 2013.
Erratum in
- Erratum for the Report "Circulating Breast Tumor Cells Exhibit Dynamic Changes in Epithelial and Mesenchymal Composition" by M. Yu, A. Bardia, B. S. Wittner, S. L. Stott, M. E. Smas, D. T. Ting, S. J. Isakoff, J. C. Ciciliano, M. N. Wells, A. M. Shah, K. F. Concannon, M. C. Donaldson, L. V. Sequist, E. Brachtel, D. Sgroi, J. Baselga, S. Ramaswamy, M. Toner, D. A. Haber, S. Maheswaran.
[No authors listed] [No authors listed] Science. 2019 Jan 25;363(6425):eaaw7579. doi: 10.1126/science.aaw7579. Science. 2019. PMID: 30679345 No abstract available.
Abstract
Epithelial-mesenchymal transition (EMT) of adherent epithelial cells to a migratory mesenchymal state has been implicated in tumor metastasis in preclinical models. To investigate its role in human cancer, we characterized EMT in circulating tumor cells (CTCs) from breast cancer patients. Rare primary tumor cells simultaneously expressed mesenchymal and epithelial markers, but mesenchymal cells were highly enriched in CTCs. Serial CTC monitoring in 11 patients suggested an association of mesenchymal CTCs with disease progression. In an index patient, reversible shifts between these cell fates accompanied each cycle of response to therapy and disease progression. Mesenchymal CTCs occurred as both single cells and multicellular clusters, expressing known EMT regulators, including transforming growth factor (TGF)-β pathway components and the FOXC1 transcription factor. These data support a role for EMT in the blood-borne dissemination of human breast cancer.
Figures
Fig. 1
RNA-ISH analysis of EMT markers in human breast tumors. Representative RNA-ISH analysis of pooled epithelial (E) (red dots, arrowheads) and mesenchymal (M) (dark blue dots, arrows) markers in (A) primary tumor and (B) tumor-infiltrated lymph node of a patient with ductal ER+/PR+ type breast cancer. (C) RNA-ISH analysis of HER2 (red dots, arrowheads) and M (dark blue dots, arrows) expression in a HER2+ primary breast tumor. (D) Quantitation of E and M dual-positive tumor cells (percentage of total tumor cells) in a TMA consisting of premalignant DCIS (N = 7 cases) and ER+/PR+ (N = 20 cases), HER2+ (N = 9 cases), and TN (N = 16 cases) breast cancers. A representative image from a TN case is shown on the right. E, red dots; M, dark blue dots; nuclei are stained with hematoxylin, light blue. Scale bars: (A) to (D), 20 μm; inserts, 10 μm.
Fig. 2
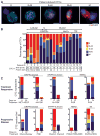
RNA-ISH analysis of EMT markers in CTCs from patients with metastatic breast cancer. (A) Representative images of five types of CTCs isolated from patients with metastatic breast cancer, based on RNA-ISH staining of E (green dots) and M (red dots) markers. Scale bar, 5 μm (B) Quantitation of EMT features in CTCs based on E and M RNA-ISH staining of histological subtypes of breast cancer [lobular, ductal, and U (unknown)], along with molecular classification (ER/PR, HER2, TN). CTC numbers per 3 ml of blood based on RNA (E+M) or protein (CK) staining are listed below. (C) Fractionation of CTCs according to E/M ratios in five patients who were clinically responding to treatment (top) and five patients who had progressive disease on treatment (bottom). The subtype of breast cancer, each patient’s treatment regimen, and the number of days on treatment are shown. The drugs used to inhibit the signaling pathways shown on the figure are as follows: MET + VEGF (vascular endothelial growth factor), cabozantinib; AI (aromatase inhibitor), letrozole; PI3K (phosphatidylinositol 3-kinase), BKM120, INK1117, and BYL719; PI3K/mTOR (mammalian target of rapamycin), SAR245409; MEK (MAP kinase kinase), MSC193639B; EGFR/HER3 (human epidermal growth factor receptor 3), MEHD7945A. The chemotherapeutic drugs used were cisplatin, taxol, and adriamycin. Tumor genotypes are given in table S2.
Fig. 3
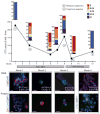
Longitudinal monitoring of EMT features in CTCs from an index patient. Plot of CTC counts per 3 ml of blood based on RNA (E and M markers) detection methods in a patient with KRAS- and PIK3CA-mutant ER/PR+ lobular breast cancer, who was serially sampled during treatment with inhibitors targeting the PI3K (GDC0941) and MEK (GDC0973) pathways, followed by adriamycin chemotherapy. Color-coded quantitation of EMT features based on RNA-ISH staining is shown above each time point. Treatment history and clinical responses are noted on the chart. P, disease progression; R, treatment response). M+ clusters were detected at time points 1, 8, and 12. Images of CTCs staining for E (green) and M (red) markers and protein staining for CK (red), CD45 (green), or platelet marker CD61 (green) from different time points are shown below the chart. The number of single CTCs (S-CTC) detected on the entire CTC-chip upon processing 3 ml of blood and the number of CTCs within the CTC clusters (C-CTC) are indicated. Nuclei are stained with 4′,6-diamidino-2-phenylindole (DAPI) (blue). Scale bar, 10 μm. Criteria for disease progression (P) or treatment response (R) are described in the supplementary materials.
Fig. 4
RNA-sequence analysis of transcripts enriched in CTCs. Heat map representing transcripts enriched in CTCs captured from the index patient, who was sampled at multiple time points during treatment. A CTC signature of 45 genes was derived by comparing 5 time points from the patient (rows 1 to 5) with identically processed blood specimens from 10 healthy donors (HDs) (rows 6 to 15). An EMT-specific signature of 170 genes was derived from comparing M+ cluster-enriched CTCs (row 4) with E+ CTCs. Red and blue colors indicate relative high and low gene expression, respectively. Categories of gene signatures in the GSEA database are shown for both the 45 gene CTC signature and the 170 gene EMT-cluster CTC signature, with genes contributing to the enrichment highlighted in green. The number of enriched signatures within each category is given in parentheses.
Comment in
- Breast cancer: Circulating and dynamic EMT.
Burgess DJ. Burgess DJ. Nat Rev Cancer. 2013 Mar;13(3):148. doi: 10.1038/nrc3475. Epub 2013 Feb 14. Nat Rev Cancer. 2013. PMID: 23407577 No abstract available. - Breast cancer: Epithelial-mesenchymal transitions in human breast cancer samples.
Marchesi V. Marchesi V. Nat Rev Clin Oncol. 2013 Apr;10(4):184. doi: 10.1038/nrclinonc.2013.26. Epub 2013 Feb 19. Nat Rev Clin Oncol. 2013. PMID: 23419957 No abstract available. - Tumor dissemination: an EMT affair.
Thiery JP, Lim CT. Thiery JP, et al. Cancer Cell. 2013 Mar 18;23(3):272-3. doi: 10.1016/j.ccr.2013.03.004. Cancer Cell. 2013. PMID: 23518345
Similar articles
- Matrix metalloproteinase 1 and circulating tumor cells in early breast cancer.
Cierna Z, Mego M, Janega P, Karaba M, Minarik G, Benca J, Sedlácková T, Cingelova S, Gronesova P, Manasova D, Pindak D, Sufliarsky J, Danihel L, Reuben JM, Mardiak J. Cierna Z, et al. BMC Cancer. 2014 Jun 28;14:472. doi: 10.1186/1471-2407-14-472. BMC Cancer. 2014. PMID: 24972610 Free PMC article. - Relationship between circulating tumor cells and epithelial to mesenchymal transition in early breast cancer.
Mego M, Cierna Z, Janega P, Karaba M, Minarik G, Benca J, Sedlácková T, Sieberova G, Gronesova P, Manasova D, Pindak D, Sufliarsky J, Danihel L, Reuben JM, Mardiak J. Mego M, et al. BMC Cancer. 2015 Jul 22;15:533. doi: 10.1186/s12885-015-1548-7. BMC Cancer. 2015. PMID: 26194471 Free PMC article. - Circulating tumour cells escape from EpCAM-based detection due to epithelial-to-mesenchymal transition.
Gorges TM, Tinhofer I, Drosch M, Röse L, Zollner TM, Krahn T, von Ahsen O. Gorges TM, et al. BMC Cancer. 2012 May 16;12:178. doi: 10.1186/1471-2407-12-178. BMC Cancer. 2012. PMID: 22591372 Free PMC article. - Expression of Epithelial Mesenchymal Transition and Cancer Stem Cell Markers in Circulating Tumor Cells.
Werner S, Stenzl A, Pantel K, Todenhöfer T. Werner S, et al. Adv Exp Med Biol. 2017;994:205-228. doi: 10.1007/978-3-319-55947-6_11. Adv Exp Med Biol. 2017. PMID: 28560676 Review. - Expression of stem cell and epithelial-mesenchymal transition markers in circulating tumor cells of breast cancer patients.
Krawczyk N, Meier-Stiegen F, Banys M, Neubauer H, Ruckhaeberle E, Fehm T. Krawczyk N, et al. Biomed Res Int. 2014;2014:415721. doi: 10.1155/2014/415721. Epub 2014 May 8. Biomed Res Int. 2014. PMID: 24895575 Free PMC article. Review.
Cited by
- Early Dissemination of Circulating Tumor Cells: Biological and Clinical Insights.
Chemi F, Mohan S, Guevara T, Clipson A, Rothwell DG, Dive C. Chemi F, et al. Front Oncol. 2021 May 7;11:672195. doi: 10.3389/fonc.2021.672195. eCollection 2021. Front Oncol. 2021. PMID: 34026650 Free PMC article. Review. - CD26-positive/CD326-negative circulating cancer cells as prognostic markers for colorectal cancer recurrence.
Lieto E, Galizia G, Orditura M, Romano C, Zamboli A, Castellano P, Mabilia A, Auricchio A, DE Vita F, Gemei M. Lieto E, et al. Oncol Lett. 2015 Feb;9(2):542-550. doi: 10.3892/ol.2014.2749. Epub 2014 Dec 1. Oncol Lett. 2015. PMID: 25624884 Free PMC article. - Advances in the Biology, Detection Techniques, and Clinical Applications of Circulating Tumor Cells.
Wu S, Zhao S, Cui D, Xie J. Wu S, et al. J Oncol. 2022 Sep 2;2022:7149686. doi: 10.1155/2022/7149686. eCollection 2022. J Oncol. 2022. PMID: 36090904 Free PMC article. Review. - Folate receptor-positive circulating tumor cells predict survival and recurrence patterns in patients undergoing resection for pancreatic cancer.
Cheng H, Yang J, Fu X, Mao L, Chu X, Lu C, Li G, Qiu Y, He W. Cheng H, et al. Front Oncol. 2022 Oct 13;12:1012609. doi: 10.3389/fonc.2022.1012609. eCollection 2022. Front Oncol. 2022. PMID: 36313690 Free PMC article. - Breast cancer: Circulating and dynamic EMT.
Burgess DJ. Burgess DJ. Nat Rev Cancer. 2013 Mar;13(3):148. doi: 10.1038/nrc3475. Epub 2013 Feb 14. Nat Rev Cancer. 2013. PMID: 23407577 No abstract available.
References
- Nguyen DX, Bos PD, Massagué J. Nat Rev Cancer. 2009;9:274. - PubMed
- Thiery JP. Nat Rev Cancer. 2002;2:442. - PubMed
- Brabletz T. Nat Rev Cancer. 2012;12:425. - PubMed
- Ledford H. Nature. 2011;472:273. - PubMed
Publication types
MeSH terms
Substances
Grants and funding
- R01 CA129933/CA/NCI NIH HHS/United States
- EB008047/EB/NIBIB NIH HHS/United States
- HHMI/Howard Hughes Medical Institute/United States
- U01 EB012493/EB/NIBIB NIH HHS/United States
- R01 EB008047/EB/NIBIB NIH HHS/United States
- NCI CA129933/CA/NCI NIH HHS/United States
- K12 CA087723/CA/NCI NIH HHS/United States
LinkOut - more resources
Full Text Sources
Other Literature Sources
Medical
Molecular Biology Databases


