T cell activation induces proteasomal degradation of Argonaute and rapid remodeling of the microRNA repertoire - PubMed (original) (raw)
. 2013 Feb 11;210(2):417-32.
doi: 10.1084/jem.20111717. Epub 2013 Feb 4.
Alejandro V Villarino, Christopher J Eisley, Rebecca Barbeau, Andrea J Barczak, Gitta A Heinz, Elisabeth Kremmer, Vigo Heissmeyer, Michael T McManus, David J Erle, Anjana Rao, K Mark Ansel
Affiliations
- PMID: 23382546
- PMCID: PMC3570096
- DOI: 10.1084/jem.20111717
T cell activation induces proteasomal degradation of Argonaute and rapid remodeling of the microRNA repertoire
Yelena Bronevetsky et al. J Exp Med. 2013.
Abstract
Activation induces extensive changes in the gene expression program of naive CD4(+) T cells, promoting their differentiation into helper T cells that coordinate immune responses. MicroRNAs (miRNAs) play a critical role in this process, and miRNA expression also changes dramatically during T cell differentiation. Quantitative analyses revealed that T cell activation induces global posttranscriptional miRNA down-regulation in vitro and in vivo. Argonaute (Ago) proteins, the core effector proteins of the miRNA-induced silencing complex (miRISC), were also posttranscriptionally down-regulated during T cell activation. Ago2 was inducibly ubiquitinated in activated T cells and its down-regulation was inhibited by the proteasome inhibitor MG132. Therefore, activation-induced miRNA down-regulation likely occurs at the level of miRISC turnover. Measurements of miRNA-processing intermediates uncovered an additional layer of activation-induced, miRNA-specific transcriptional regulation. Thus, transcriptional and posttranscriptional mechanisms cooperate to rapidly reprogram the miRNA repertoire in differentiating T cells. Altering Ago2 expression in T cells revealed that Ago proteins are limiting factors that determine miRNA abundance. Naive T cells with reduced Ago2 and miRNA expression differentiated more readily into cytokine-producing helper T cells, suggesting that activation-induced miRNA down-regulation promotes acquisition of helper T cell effector functions by relaxing the repression of genes that direct T cell differentiation.
Figures
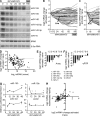
Figure 1.
T cell activation leads to global miRNA depletion. (A) Northern blot analysis of indicated miRNAs in naive CD4+ T cells, and CD4+ T cells stimulated for the indicated amounts of time with anti-CD3 and anti-CD28. tRNA and 5.8S rRNA are used as loading controls. (B) Array analysis of 114 miRNAs in naive CD4+ T cells, and CD4+ T cells stimulated for the indicated amounts of time with anti-CD3 and anti-CD28. Data are relative to naive cells and were normalized to tRNA. (C) Array analysis of 174 miRNAs in naive human peripheral blood CD4+ T cells and CD4+ T cells stimulated with anti-CD3 and anti-CD28. Data are relative to naive, normalized to tRNA. (D) miRNA expression in naive and 48 h in vitro–activated T cells. The x axis denotes raw intensity of all probes in the naive group and y axis denotes the fold difference between activated and naive groups, normalized to tRNA (Log2) Open circles with numbers correspond to chart in E and F. (E) Bar graph denotes expression of selected miRNAs in the activated group as measured by array normalized to tRNA. (F) Bar graph denotes expression of selected miRNAs in the activated group as measured by qRT-PCR normalized to 5.8S rRNA. (G) Relative Luciferase activity from sensors for miR-150, 19b, 191, and vector control at indicated times. Data are the mean of at least five replicates and four independent experiments. *, P < 0.05; **, P < 0.01, two-way ANOVA. (H) Log2 fold difference between 24-h activated and naive T cells (x-axis) and log2 fold difference between 24-h restimulated and resting T cells (Y-axis). Data are representative of at least two independent experiments.
Figure 2.
Ago proteins are posttranscriptionally down-regulated upon T cell activation. (A) qRT-PCR analysis of indicated mRNAs in naive and stimulated CD4+ T cells. Data are normalized to β-actin. (B) Immunoblot analysis of indicated proteins in naive and stimulated CD4+ T cells. Rpl5 serves as a loading control. (C) qRT-PCR analysis of Ago1, Ago2, and Ago3 in naive and stimulated CD4+ T cells. Data are normalized to β-actin. (D) Immunoblot analysis of Ago1 and Ago2 in naive and stimulated CD4+ T cells. Rpl5 serves as a loading control. (E) Immunoblot analysis of pan-Ago in naive and stimulated CD4+ T cells as in D. PCR data are the mean of two duplicate reactions. Data are representative of at least three experiments.
Figure 3.
Ago2 is limiting for T cell miRNA expression. (A) Flow cytometry analysis of staining for CD4 and CD8 (left) in mixed spleen and lymph nodes from 4–6-wk-old Ago2+/+; CD4-cre and _Ago2_fl/fl; CD4-cre mice. Flow cytometry analysis of staining for CD62L and CD44 (right) in mixed spleen and lymph nodes. (B) Immunoblot analysis of Ago2 in naive CD4+ T cells from Ago2+/+, and _Ago2_fl/fl; CD4-cre mice. β-Actin serves as a loading control. (C) qRT-PCR analysis of indicated miRNAs in naive CD4+ T cells from Ago2+/+, Ago2+/fl and _Ago2_fl/fl; CD4-cre mice. Data are normalized to 5.8S, and are represented relative to WT. (D) Immunoblot analysis of Ago2 in 6-d cultured Ago2+/+ and _Ago2_fl/fl; CD4-cre CD4+ T cells transduced on day 2 with Ago2 retrovirus or empty retrovirus control. (E) qRT-PCR analysis of indicated miRNAs in 6-d cultured _Ago2_fl/fl; CD4-cre CD4+ T cells transduced on day 2 with Ago2 retrovirus or empty retrovirus control. Data are representative of three experiments, and error bars represent standard error of the mean. n.d., not detected.
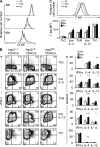
Figure 4.
Increased effector cytokine production in Ago2-deficient T cells. (A) Flow cytometry analysis of staining for CFSE in CD4+ T cells cultured for the indicated times in nonpolarizing conditions. (B) Flow cytometry analysis (left) of intracellular staining for IFN-γ and IL-4 production by restimulated T cells isolated from _CD4-cre Ago2_fl/fl (ko), Ago2+/fl (het) or Ago2+/+ (wt) mice differentiated for 1 wk under Th2, low IL-4, ThN, low IL-12, and Th1 conditions. Numbers indicate percentage of cells in each quadrant. Bar graphs (right) show percentage of CD4+ cells producing IFN-γ, IL-4, and IL-13 in the conditions on the left. *, P < 0.05; **, P < 0.01; ***, P < 0.001, two-way ANOVA. (C) Flow cytometry analysis (top) of intracellular staining for T-bet in T cells differentiated for 1 wk in low IL-12 conditions. Bar graphs (bottom) show T-bet mean fluorescence intensity (MFI) in CD4+ cells under Th2, low IL-4, ThN, low IL-12, and Th1 conditions. Data are representative of three experiments, and error bars represent standard error of the mean.
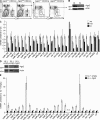
Figure 5.
Activation-induced transcriptional regulation leads to differential expression of mature miRNAs. (A) Quantitative PCR analysis of indicated miRNAs in naive and stimulated CD4+ T cells. Data are relative to naive, normalized to 5.8S rRNA. (B) PCR analysis of indicated pri-miRNAs in naive and stimulated CD4+ T cells. Data are normalized to 28S rRNA. qRT-PCR data are representative of 10 experiments.
Figure 6.
Efficient miRNA processing occurs in activated T cells. (A) Graphical representation of pri-miRNA and pre-miRNA primers shows those spanning one arm of the stem loop and the flanking sequence (pri-miR), and those within the stem loop (pre-miR). (B) Validation of size fractionation technique shows thermal cycle (Ct) values for qRT-PCR performed with pri-miR-142 and pre-miR-142 primers in the small and large RNA fractions. Dotted line represents limit of detection. (C) qRT-PCR analysis of pri-, pre-, and mature miR-21 in naive and stimulated CD4+ T cells. Data are relative to naive, normalized to 28S rRNA (pri-miRNA), 5S rRNA (pre-miRNA), and 5.8S rRNA (mature miRNA). Data in A–C are representative of five experiments. (D) A Northern blot analysis of pre- and mature miR-21, tRNA, and 5.8S rRNA in naive CD4+ T cells and CD4+ T cells stimulated for the indicated amounts of time with anti-CD3 and anti-CD28. Bottom pre-miR-21 panel is a higher exposure.
Figure 7.
miRNA depletion and Ago2 down-regulation occurs during in vivo T cell activation. (A) miRNA expression in in vivo activated OVA-specific T cells as measured by qRT-PCR normalized to 18S rRNA. Data are representative of at least five experiments, and error bars indicate the standard deviation between replicate measurements. (B) Log2 fold difference between in vivo activated and naive T cells (y axis) and log2 fold difference between 65h in vitro–activated and naive T cells (x axis). (C) Immunoblot analysis of Ago2 and RPL5 protein in naive and in vivo–activated, OVA-specific T cells. Data are representative of two independent experiments.
Figure 8.
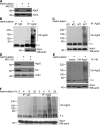
Ago2 is ubiquitinated and degraded by the proteasome. (A) Immunoblot analysis of Ago2 and actin protein in resting, 24 h restimulated T cells, and 24 h restimulated cells with MG-132 added in the last 2 h of culture. (B) IgG (left) or Ago2 (right) immunoprecipitation from resting and 24 h restimulated T cells. All cultures were treated with MG-132 in the last 4 h of culture. Immunoprecipitates were blotted with anti-ubiquitin and 4% input from resting and restimulated cells was blotted with anti-β-actin. Data in A and B are representative of at least five independent experiments. (C) Resting and 24 h restimulated Ago2-deficient (left) or WT (right) T cells. Immunoprecipitation was performed with anti-Ago2 antibody and blotted with anti-ubiquitin antibody. 4% input from resting and restimulated cells was blotted with anti-β-actin. (D) Immunoblot of Ago2, HA, and β-actin from cells transduced with HA-Ago2 retrovirus. Cells were rested until day 5 and restimulated for 24 h with MG-132 or DMSO in the last 4 h of culture. (E) Empty vector (left) and HA-Ago2 retrovirus-transduced (right) T cells that were either rested or restimulated for 24 h. Immunoprecipitation was performed with anti-HA antibody and were blotted with anti-ubiquitin antibody. 4% input from resting and restimulated cells were blotted with anti–β-actin. (F) IgG (left) or Ago2 (right) immunoprecipitation from resting, 4-h, 12-h, and 20-h restimulated T cells. All cultures were treated with MG-132 in the last 4 h of culture. Immunoprecipitates were blotted with anti-ubiquitin, and 4% input from resting and restimulated cells was blotted with anti–β-actin. Data in C–F are representative of two independent experiments. h.c., heavy chain; Ub-Ago2, ubiquitinated Ago2.
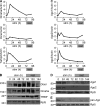
Figure 9.
Continuous mTOR signaling is required for Ago2 degradation. (A) Immunoblot analysis of Ago2 and β-actin from resting T cells and T cells restimulated for 16 h plus 4 h treatment with indicated inhibitor. (B) Immunoblot analysis of Ago2 and β-actin from resting T cells and T cells restimulated for 16 h plus 4 h treatment with indicated inhibitor. (C) Immunoblot analysis of Ago2 and β-actin from 16-h restimulated T cells. Cells were then treated with 4 h DMSO (left) or rapamycin for indicated times (right). (D) Immunoblot analysis of Ago2 and β-actin from resting and 16-h restimulated T cells. Cells were then treated with 4-h DMSO (right), actinomycin (left), or cycloheximide (right) for indicated times. Data are representative of at least three independent experiments.
Similar articles
- Posttranscriptional Gene Regulation of T Follicular Helper Cells by RNA-Binding Proteins and microRNAs.
Baumjohann D, Heissmeyer V. Baumjohann D, et al. Front Immunol. 2018 Jul 31;9:1794. doi: 10.3389/fimmu.2018.01794. eCollection 2018. Front Immunol. 2018. PMID: 30108596 Free PMC article. Review. - Microbial Disruption of Autophagy Alters Expression of the RISC Component AGO2, a Critical Regulator of the miRNA Silencing Pathway.
Sibony M, Abdullah M, Greenfield L, Raju D, Wu T, Rodrigues DM, Galindo-Mata E, Mascarenhas H, Philpott DJ, Silverberg MS, Jones NL. Sibony M, et al. Inflamm Bowel Dis. 2015 Dec;21(12):2778-86. doi: 10.1097/MIB.0000000000000553. Inflamm Bowel Dis. 2015. PMID: 26332312 Free PMC article. - Dysregulated RNA-Induced Silencing Complex (RISC) Assembly within CNS Corresponds with Abnormal miRNA Expression during Autoimmune Demyelination.
Lewkowicz P, Cwiklińska H, Mycko MP, Cichalewska M, Domowicz M, Lewkowicz N, Jurewicz A, Selmaj KW. Lewkowicz P, et al. J Neurosci. 2015 May 13;35(19):7521-37. doi: 10.1523/JNEUROSCI.4794-14.2015. J Neurosci. 2015. PMID: 25972178 Free PMC article. - Profiling of T helper cell-derived small RNAs reveals unique antisense transcripts and differential association of miRNAs with argonaute proteins 1 and 2.
Polikepahad S, Corry DB. Polikepahad S, et al. Nucleic Acids Res. 2013 Jan;41(2):1164-77. doi: 10.1093/nar/gks1098. Epub 2012 Nov 26. Nucleic Acids Res. 2013. PMID: 23185045 Free PMC article. - Regulation and different functions of the animal microRNA-induced silencing complex.
Frédérick PM, Simard MJ. Frédérick PM, et al. Wiley Interdiscip Rev RNA. 2022 Jul;13(4):e1701. doi: 10.1002/wrna.1701. Epub 2021 Nov 1. Wiley Interdiscip Rev RNA. 2022. PMID: 34725940 Review.
Cited by
- Non-coding RNAs: Epigenetic regulators of bone development and homeostasis.
Hassan MQ, Tye CE, Stein GS, Lian JB. Hassan MQ, et al. Bone. 2015 Dec;81:746-756. doi: 10.1016/j.bone.2015.05.026. Epub 2015 May 31. Bone. 2015. PMID: 26039869 Free PMC article. Review. - Induced miR-99a expression represses Mtor cooperatively with miR-150 to promote regulatory T-cell differentiation.
Warth SC, Hoefig KP, Hiekel A, Schallenberg S, Jovanovic K, Klein L, Kretschmer K, Ansel KM, Heissmeyer V. Warth SC, et al. EMBO J. 2015 May 5;34(9):1195-213. doi: 10.15252/embj.201489589. Epub 2015 Feb 23. EMBO J. 2015. PMID: 25712478 Free PMC article. - Regulation of microRNA function in animals.
Gebert LFR, MacRae IJ. Gebert LFR, et al. Nat Rev Mol Cell Biol. 2019 Jan;20(1):21-37. doi: 10.1038/s41580-018-0045-7. Nat Rev Mol Cell Biol. 2019. PMID: 30108335 Free PMC article. Review. - Posttranscriptional Gene Regulation of T Follicular Helper Cells by RNA-Binding Proteins and microRNAs.
Baumjohann D, Heissmeyer V. Baumjohann D, et al. Front Immunol. 2018 Jul 31;9:1794. doi: 10.3389/fimmu.2018.01794. eCollection 2018. Front Immunol. 2018. PMID: 30108596 Free PMC article. Review. - MicroRNA regulation of CD8+ T cell responses.
Gagnon JD, Ansel KM. Gagnon JD, et al. Noncoding RNA Investig. 2019 Aug;3:24. doi: 10.21037/ncri.2019.07.02. Epub 2019 Aug 26. Noncoding RNA Investig. 2019. PMID: 31844841 Free PMC article.
References
Publication types
MeSH terms
Substances
Grants and funding
- R56AI089828/AI/NIAID NIH HHS/United States
- R01 HL109102/HL/NHLBI NIH HHS/United States
- T34 GM008078/GM/NIGMS NIH HHS/United States
- R01GM08078/GM/NIGMS NIH HHS/United States
- R01 DA026065/DA/NIDA NIH HHS/United States
- P30 DK063720/DK/NIDDK NIH HHS/United States
- R01DA026065/DA/NIDA NIH HHS/United States
- R01HL109102/HL/NHLBI NIH HHS/United States
- R56 AI089828/AI/NIAID NIH HHS/United States
LinkOut - more resources
Full Text Sources
Other Literature Sources
Molecular Biology Databases
Research Materials
