BMP4-mediated brown fat-like changes in white adipose tissue alter glucose and energy homeostasis - PubMed (original) (raw)
. 2013 Feb 26;110(9):E798-807.
doi: 10.1073/pnas.1215236110. Epub 2013 Feb 6.
Yan Tang, Xi Li, Yuan Liu, You-You Zhang, Hai-Yan Huang, Rui-Dan Xue, Hao-Yong Yu, Liang Guo, Hui-Di Gao, Yan Liu, Xia Sun, Yi-Ming Li, Wei-Ping Jia, Qi-Qun Tang
Affiliations
- PMID: 23388637
- PMCID: PMC3587258
- DOI: 10.1073/pnas.1215236110
BMP4-mediated brown fat-like changes in white adipose tissue alter glucose and energy homeostasis
Shu-Wen Qian et al. Proc Natl Acad Sci U S A. 2013.
Abstract
Expression of bone morphogenetic protein 4 (BMP4) in adipocytes of white adipose tissue (WAT) produces "white adipocytes" with characteristics of brown fat and leads to a reduction of adiposity and its metabolic complications. Although BMP4 is known to induce commitment of pluripotent stem cells to the adipocyte lineage by producing cells that possess the characteristics of preadipocytes, its effects on the mature white adipocyte phenotype and function were unknown. Forced expression of a BMP4 transgene in white adipocytes of mice gives rise to reduced WAT mass and white adipocyte size along with an increased number of a white adipocyte cell types with brown adipocyte characteristics comparable to those of beige or brite adipocytes. These changes correlate closely with increased energy expenditure, improved insulin sensitivity, and protection against diet-induced obesity and diabetes. Conversely, BMP4-deficient mice exhibit enlarged white adipocyte morphology and impaired insulin sensitivity. We identify peroxisome proliferator-activated receptor gamma coactivator 1-α (PGC1α) as the target of BMP signaling required for these brown fat-like changes in WAT. This effect of BMP4 on WAT appears to extend to human adipose tissue, because the level of expression of BMP4 in WAT correlates inversely with body mass index. These findings provide a genetic and metabolic basis for BMP4's role in altering insulin sensitivity by affecting WAT development.
Conflict of interest statement
The authors declare no conflict of interest.
Figures
Fig. 1.
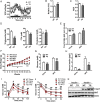
High expression of BMP4 remodels WAT and produces a lean phenotype. (A and B) Linear regression analysis between BMI and BMP4 mRNA levels in subcutaneous (n = 32) (A) and visceral (n = 22) (B) adipose tissue. (C) Western blot analysis of BMP4 expression levels in WAT and BAT from WT and Fabp4-BMP4 TG mice. (D) Comparison of inguinal WAT, gonadal WAT, and BAT from WT (Left) and TG (Right) mice. (E) Fat index (percentage of fat pad weight relative to the whole body weight) of inguinal WAT, gonadal WAT, and BAT in WT and TG mice (n = 4). (F) H&E staining of inguinal WAT, gonadal WAT, and BAT from WT and TG mice. (Scale bar: 20 μm.) (G) Quantification of adipocyte diameter of inguinal WAT, gonadal WAT, and BAT from WT and TG mice. (Data were collected from H&E-stained sections from three individual mice, five fields per mouse, 10–15 cells per field in each group, using Image J software). (H) qRT-PCR data showing the fold induction of indicated genes with expression normalized to the housekeeping gene 18S in inguinal WAT of WT and TG mice (n = 8). Data from 2-mo-old mice on a normal chow diet are expressed as means ± SEM. *P < 0.05, **P < 0.01, ***P < 0.001.
Fig. 2.
Increased mitochondrial biogenesis of WAT in Fabp4-BMP4 TG mice. (A) Transmission electron microscopy showing mitochondrial morphology of WAT and BAT from WT and Fabp4-BMP4 TG mice. (Scale bar: 500 nm.) (B) Mitochondrial number per nucleus was determined from electron micrographs of 20 cells from each type of adipose tissue. (C) Mitochondria (120–150) were randomly selected, and mitochondrial diameter was determined with a ruler. (D) qRT-PCR data showing the fold induction of the expression of indicated genes normalized to the housekeeping gene 18S in inguinal WAT of WT and TG mice (n = 4–6). (E) qRT-PCR data showing the fold induction of the expression of the indicated genes normalized to the housekeeping gene 18S in gonadal WAT of WT and TG mice (n = 4–7). (F) qRT-PCR data showing the fold induction of the expression of the indicated genes normalized to the housekeeping gene 18S in BAT of WT and TG mice (n = 4–7). (G) Arrest of postconfluent growth. 3T3-L1 preadipocytes were induced to differentiate by treatment with monocyte differentiation-inducing factors (MDI) with or without 20 ng/mL BMP4. Adipocytes differentiated from 3T3-L1 adipocytes at day 8 after MDI induction are stained with Oil Red O. (H) Western blot analysis of lysates (30 μg) differentiated from 3T3-L1 adipocytes at day 6 after MDI induction with or without 20 ng/mL BMP4. (I) qRT-PCR of differentiated 3T3-L1 adipocytes for expression of indicated genes at day 6 after MDI induction with or without 20 ng/mL BMP4. Data from 2-mo-old mice on a normal chow diet are expressed as means ± SEM. *P < 0.05, **P < 0.01, ***P < 0.001.
Fig. 3.
Energy expenditure and glucose metabolism in BMP4 TG mice. (A and B) Whole-body oxygen consumption rate (VO2) of WT and TG mice during a 12-h dark/12-h light cycle measured in a metabolic cage (A) and the average values for the 24-h period (B). n = 8. (C) The average values of RER in WT and TG mice calculated from data from the metabolic cage (n = 8). (D) Fasting serum triglycerides (n = 6), free fatty acid (FFA) (n = 9), and cholesterol (n = 6) levels in WT and TG mice. (E) Daily food intake of WT and Fabp4-BMP4 TG mice maintained on chow or an HFD. Mice were weighed each week for 4 wk. n = 12 mice per group. (F) Body weight gain of WT and TG mice maintained on chow or an HFD. n = 4 mice per group. (G and H) Fasting serum glucose (n = 6) (G) and insulin concentrations (n = 6) (H) in WT and TG mice maintained on chow or an HFD. (I and J) Glucose concentrations during an i.p. glucose tolerance test (n = 8) (I) or an insulin tolerance test (n = 7) (J) in WT and TG mice maintained on chow or an HFD. (K) Western blot analysis of insulin-stimulated phosphorylation of AKT in inguinal WAT extracts from WT and TG 6-mo-old mice maintained on chow. Data are expressed as means ± SEM. For WT vs. TG mice fed chow: *P < 0.05, **P < 0.01, ***P < 0.001; for WT vs. TG mice fed a high-fat diet: #P < 0.05, ##P < 0.01, ###P < 0.001. (Twenty-four-week-old mice were maintained on chow or were fed an HFD beginning at age 6 wk.)
Fig. 4.
Active metabolic WAT in Fabp4-BMP4 TG mice is dependent on PGC1α. Adenovirus expressing PGC1α shRNA was injected weekly s.c. adjacent to one side of the inguinal fat pad, and LacZ shRNA was injected at the contralateral site as a control for 4 wk beginning at age 4 wk. (A) Comparison of inguinal WAT fat pads in the TG mouse after treatment with PGC1α or Lac Z shRNA. (B) H&E staining of the inguinal WAT fat pad in the TG mouse after treatment with PGC1α or Lac Z shRNA. (Scale bar: 20 μm.) (C) qRT-PCR showing the fold induction of the expression of the indicated genes normalized to the housekeeping gene 18S in the inguinal WAT fat pad in the TG mouse after treatment with PGC1α or Lac Z shRNA (n = 4). (D) Western blot analyzing insulin-stimulated phosphorylation of AKT from the inguinal WAT fat pad in the TG mouse after treatment with PGC1α or Lac Z shRNA. (E and F) Linear regression analysis between BMP4 and PGC1α mRNA levels in subcutaneous (n = 32) (E) and visceral (n = 22) (F) adipose tissue.
Fig. 5.
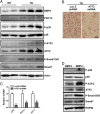
Active metabolic WAT in Fabp4-BMP4 TG mice was regulated by the p38/MAPK/ATF2 pathway. (A) Western blot analysis of the expression level of molecules involved in the BMP-signaling pathway in inguinal WAT from 2-mo-old WT and Fabp4-BMP4 TG mice maintained on a chow diet. (B) H&E staining of inguinal WAT in the TG mouse after treatment with ATF2 or Lac Z shRNA. (Scale bar: 20 μm.) (C) qRT-PCR showing the fold induction of the expression of the indicated genes normalized to the housekeeping gene 18S in the inguinal WAT of the TG mouse after treatment with ATF2 or Lac Z shRNA (n = 4). The method of ATF2 shRNA adenovirus treatment was the same as the treatment with PGC1α shRNA in Fig. 4. (D) Western blot analysis of lysates (30 μg) from differentiated 3T3-L1 adipocytes at day 4 after MDI induction with or without BMP4 (20 ng/mL).
Fig. 6.
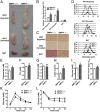
BMP4-knockout mice had increased adipose tissue mass and reduced insulin sensitivity. (A) Comparison of inguinal WAT, gonadal WAT, and BAT in BMP4+/+ (Left) and BMP4−/− (Right) mice. (B) Fat index (percentage of fat pad weight relative to the whole body weight) of inguinal WAT, gonadal WAT, and BAT in BMP4+/+ and BMP4−/− mice (n = 7–8). (C) H&E staining of inguinal WAT, gonadal WAT, and BAT from BMP4+/+ and BMP4−/− mice. (Scale bar: 20 μm.) (D) Quantification of cell size of inguinal WAT, gonadal WAT, and BAT in H&E-stained sections from three individual mice, five fields per mouse, 10–15 cells per field, using Image J software. (E_–_H) Fasting serum triglycerides (n = 6) (E), free fatty acid (FFA) (n = 7) (F), cholesterol (n = 8) (G), and leptin in BMP4+/+ (n = 7) and BMP4−/− (n = 5) (H) mice. (I and J) Fasting serum glucose concentrations (n = 8) (I) and insulin concentrations (J) in BMP4+/+ (n = 6) and BMP4−/− (n = 8) mice. (K and L) Glucose concentrations during an i.p. glucose tolerance test (n = 5) (K) or an insulin tolerance test (n = 5) (L) in BMP4+/+ and BMP4−/− mice. BMP4+/+, Fabp4-cre-BMP4+/+; BMP4−/−, Fabp4-cre-BMP4loxP/loxP. Data from 6-mo-old mice on a normal chow diet are expressed as means ± SEM. *P < 0.05, **P < 0.01, ***P < 0.001.
Fig. P1.
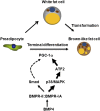
Induced expression of BMP4 gives rise to a brown adipose-like phenotype in white adipose tissue. BMP4 activation induces white adipocytes to develop into brown fat-like adipocytes with increased mitochondrial biogenesis and energy expenditure. BMP4-mediated expression of PGC1α through the p38/MAPK/ATF2 pathway regulates the procedure. BMPR, Bone morphogenic protein receptor. Smad, mothers against decapentaplegic homolog.
Similar articles
- BMP4 and BMP7 induce the white-to-brown transition of primary human adipose stem cells.
Elsen M, Raschke S, Tennagels N, Schwahn U, Jelenik T, Roden M, Romacho T, Eckel J. Elsen M, et al. Am J Physiol Cell Physiol. 2014 Mar 1;306(5):C431-40. doi: 10.1152/ajpcell.00290.2013. Epub 2013 Nov 27. Am J Physiol Cell Physiol. 2014. PMID: 24284793 - Bmp4 Promotes a Brown to White-like Adipocyte Shift.
Modica S, Straub LG, Balaz M, Sun W, Varga L, Stefanicka P, Profant M, Simon E, Neubauer H, Ukropcova B, Ukropec J, Wolfrum C. Modica S, et al. Cell Rep. 2016 Aug 23;16(8):2243-2258. doi: 10.1016/j.celrep.2016.07.048. Epub 2016 Aug 11. Cell Rep. 2016. PMID: 27524617 - Milk fat globule membrane and its component phosphatidylcholine induce adipose browning both in vivo and in vitro.
Li T, Du M, Wang H, Mao X. Li T, et al. J Nutr Biochem. 2020 Jul;81:108372. doi: 10.1016/j.jnutbio.2020.108372. Epub 2020 Mar 17. J Nutr Biochem. 2020. PMID: 32416448 - The colorful versatility of adipocytes: white-to-brown transdifferentiation and its therapeutic potential in humans.
Maurer S, Harms M, Boucher J. Maurer S, et al. FEBS J. 2021 Jun;288(12):3628-3646. doi: 10.1111/febs.15470. Epub 2020 Jul 22. FEBS J. 2021. PMID: 32621398 Review. - Adipocyte lineages: tracing back the origins of fat.
Sanchez-Gurmaches J, Guertin DA. Sanchez-Gurmaches J, et al. Biochim Biophys Acta. 2014 Mar;1842(3):340-51. doi: 10.1016/j.bbadis.2013.05.027. Epub 2013 Jun 4. Biochim Biophys Acta. 2014. PMID: 23747579 Free PMC article. Review.
Cited by
- Anti-inflammatory properties of bone morphogenetic protein 4 in human adipocytes.
Baraban E, Chavakis T, Hamilton BS, Sales S, Wabitsch M, Bornstein SR, Ehrhart-Bornstein M. Baraban E, et al. Int J Obes (Lond). 2016 Feb;40(2):319-27. doi: 10.1038/ijo.2015.141. Epub 2015 Jul 31. Int J Obes (Lond). 2016. PMID: 26228459 - Yellow Teas Protect against DSS-Induced Ulcerative Colitis by Inhibiting TLR4/NF-κB/NLRP3 Inflammasome in Mice.
Xing D, Zheng T, Chen X, Xie Z. Xing D, et al. Foods. 2024 Sep 7;13(17):2843. doi: 10.3390/foods13172843. Foods. 2024. PMID: 39272608 Free PMC article. - Perivascular adipose tissue (PVAT) in atherosclerosis: a double-edged sword.
Qi XY, Qu SL, Xiong WH, Rom O, Chang L, Jiang ZS. Qi XY, et al. Cardiovasc Diabetol. 2018 Oct 10;17(1):134. doi: 10.1186/s12933-018-0777-x. Cardiovasc Diabetol. 2018. PMID: 30305178 Free PMC article. Review. - Noggin depletion in adipocytes promotes obesity in mice.
Blázquez-Medela AM, Jumabay M, Rajbhandari P, Sallam T, Guo Y, Yao J, Vergnes L, Reue K, Zhang L, Yao Y, Fogelman AM, Tontonoz P, Lusis AJ, Wu X, Boström KI. Blázquez-Medela AM, et al. Mol Metab. 2019 Jul;25:50-63. doi: 10.1016/j.molmet.2019.04.004. Epub 2019 Apr 10. Mol Metab. 2019. PMID: 31027994 Free PMC article. - BMPR2 promotes fatty acid oxidation and protects white adipocytes from cell death in mice.
Qian S, Pan J, Su Y, Tang Y, Wang Y, Zou Y, Zhao Y, Ma H, Zhang Y, Liu Y, Guo L, Tang QQ. Qian S, et al. Commun Biol. 2020 Apr 29;3(1):200. doi: 10.1038/s42003-020-0928-y. Commun Biol. 2020. PMID: 32350411 Free PMC article.
References
- Scherer PE. Adipose tissue: From lipid storage compartment to endocrine organ. Diabetes. 2006;55(6):1537–1545. - PubMed
- Klaus S. Functional differentiation of white and brown adipocytes. Bioessays. 1997;19(3):215–223. - PubMed
- Shepherd PR, et al. Adipose cell hyperplasia and enhanced glucose disposal in transgenic mice overexpressing GLUT4 selectively in adipose tissue. J Biol Chem. 1993;268(30):22243–22246. - PubMed
- Haslam DW, James WP. obesity. Lancet. 2005;366(9492):1197–1209. - PubMed
- Kopelman PG. Obesity as a medical problem. Nature. 2000;404(6778):635–643. - PubMed
Publication types
MeSH terms
Substances
LinkOut - more resources
Full Text Sources
Other Literature Sources
Molecular Biology Databases


