Regulation of microglial proliferation during chronic neurodegeneration - PubMed (original) (raw)
Regulation of microglial proliferation during chronic neurodegeneration
Diego Gómez-Nicola et al. J Neurosci. 2013.
Abstract
An important component of chronic neurodegenerative diseases is the generation of an innate inflammatory response within the CNS. Microglial and astroglial cells play a key role in the development and maintenance of this inflammatory response, showing enhanced proliferation and activation. We studied the time course and regulation of microglial proliferation, using a mouse model of prion disease. Our results show that the proliferation of resident microglial cells accounts for the expansion of the population during the development of the disease. We identify the pathway regulated by the activation of CSF1R and the transcription factors PU.1 and C/EBPα as the molecular regulators of the proliferative response, correlating with the chronic human neurodegenerative conditions variant Creutzfeldt-Jakob disease and Alzheimer's disease. We show that targeting the activity of CSF1R inhibits microglial proliferation and slows neuronal damage and disease progression. Our results demonstrate that microglial proliferation is a major component in the evolution of chronic neurodegeneration, with direct implications for understanding the contribution of the CNS innate immune response to disease progression.
Figures
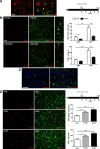
Figure 1.
Temporal and regional distribution of microglial proliferation during prion disease. A, B, Immunohistochemical analysis of the expression of Iba1 (microglia, A) and GFAP (astrocytes, B) in the CA1 region of the hippocampus (see representative images) and the thalamus of prion-diseased (ME7) and control (NBH) mice. Quantified data expressed as mean ± SEM of the number of Iba1+ (A) or GFAP+ (B) cells per square millimeter. C, D, Immunohistochemical analysis of the expression of PCNA (A) and pHH3 (B) in the CA1 region of the hippocampus (see representative images) and the thalamus of prion disease (ME7) and control (NBH) mice. Quantified data expressed as the mean ± SEM of the number of PCNA+ (A) or pHH3+ (B) cells per square millimeter. E, Analysis of proliferative microglia (white arrowheads) by double immunofluorescence for BrDU (red) and GFP (microglia, green) in the hippocampus (CA1; representative image) and thalamus of prion (ME7) or control (NBH) mice. Quantified data expressed as mean ± SEM of the number of BrDU+GFP+ cells per square millimeter. *p < 0.05, **p < 0.01, ***p < 0.001. Data were analyzed with a two-way ANOVA and a post hoc Tukey test (n = 6). A–D, Nuclei are stained with H/E (blue). E, Fluorescent sections evaluated with confocal microscopy. Scale bars: A–D (in A, C), 100 μm; A–D, insets (in A, C) 50 μm; E, 20 μm.
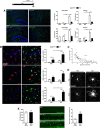
Figure 2.
Temporal and regional distribution of the regulators of microglial proliferation during prion disease. A, Analysis of the expression of mRNA of CSF1, IL34, and CSF1R in the hippocampus (CA1) and thalamus of prion disease (ME7) and control (NBH) mice. Expression of CSF1, IL34, and CSF1R is represented as mean ± SEM and indicated as relative expression levels using the 2ΔΔCt method. B, C, F–H, Immunohistochemical analysis of the expression of IL34 (B, C), PU.1 (F, G), and C/EBPa (F, H) in the CA1 region of the hippocampus (see representative images) and the thalamus of prion disease (ME7) and control (NBH) mice. Quantified data expressed as mean ± SEM of the number of IL34+, PU.1+, or C/EBP+ cells per square millimeter. D, Analysis of the expression of IL34 in glial cells by triple immunofluorescence for IL34 (red), GFP (microglia, green), and GFAP (astrocytes, blue) in the hippocampus (CA1) of prion disease mice (ME7). E, Analysis of the expression of mRNA of PU.1, GATA1, and C/EBPa in the hippocampus (CA1) and thalamus of prion disease (ME7) and control (NBH) mice. Expression of PU.1, GATA1, and C/EBPa is represented as mean ± SEM and indicated as relative expression levels using the 2ΔΔCt method. I, Analysis of the expression of PU.1 or C/EBPa (red) in microglial cells (GFP, green) by double immunofluorescence in the hippocampus (CA1) of prion disease mice (ME7). *p < 0.05, **p < 0.01, ***p < 0.001, ****p < 0.0001. Data were analyzed with a two-way ANOVA and a post hoc Tukey test (n = 6). C, G, H, Nuclei are stained with H/E (blue). I, Nuclei are stained with Hoechst (blue). D, I, Fluorescent sections evaluated with confocal microscopy. Scale bars: C, G, H, 100 μm; insets, 50 μm; D, I, 50 μm.
Figure 3.
Signaling through the CSF1R controls microglial proliferation during chronic neurodegeneration. A, B, Effect of the administration of a CSF1R blocking antibody (CSF1R Ab) on microglial proliferation (A, right). A, Immunofluorescent analysis of the binding of CSF1R Ab (red) to microglial cells (GFP+, green), expressing low (white arrowheads) or high (empty arrowheads) levels of CSF1R (GFP) in the hippocampus of prion disease mice (ME7). B, Analysis of microglial proliferation by double immunofluorescence for BrDU (red) and GFP (microglia, green) in the hippocampus of prion (ME7, representative images) or control (NBH) mice treated with CSF1R Ab or an isotype control antibody (CTL). Quantified data expressed as mean ± SEM of the number of BrDU+GFP+ (proliferative microglia) or GFP+ (total microglia) cells per square millimeter. C, Immunofluorescent analysis of the expression of activated (cleaved) caspase-3 (red) in microglial cells (GFP+, green, white arrowheads) or nonmicroglial cells (empty arrowheads) in the hippocampus of prion disease mice (ME7). D, Effect of the administration of CSF1 or IL34 on microglial proliferation during prion disease (C, right). Analysis of microglial proliferation by double immunofluorescence for BrDU (red) and GFP (microglia, green) in the hippocampus of prion (ME7) mice treated with CSF1, IL34, or saline (control, Sal). Quantified data expressed as mean ± SEM of the number of BrDU+GFP+ (proliferative microglia) or GFP+ (total microglia) cells per square millimeter. *p < 0.05, **p < 0.01, ***p < 0.001. Data were analyzed with a one- (B) or two-way (D) ANOVA and a post hoc Tukey test (n = 4). A–D, Fluorescent sections evaluated with confocal microscopy. Scale bars: A, 20 μm; B–D, 50 μm.
Figure 4.
Blockade of mitosis alters the inflammatory phenotype of microglial cells during chronic neurodegeneration. A–E, Effect of the administration of an inhibitor of mitosis (AraC) on the progression of microglial proliferation and neuropathology during prion disease (top). A, Analysis of microglial proliferation by immunohistochemistry for BrDU and GFP (microglia, green, representative images) in the hippocampus and thalamus of prion (ME7, representative images) or control (NBH) mice, treated with AraC or vehicle (saline, Sal), compared with naive mice. Quantified data expressed as mean ± SEM of the number of BrDU+ or GFP+ cells per square millimeter. B, Effect of AraC on the expression of inflammatory markers in microglial cells, analyzed by double immunofluorescence for CD11c, MHCII, or IL1b (red), and GFP (green, microglia), on the hippocampus of prion (ME7) or control (NBH) mice. Quantified data expressed as mean ± SEM of the ratio of CD11c+, MHCII+ or IL1b+ versus the total number of GFP+ microglial cells. C, Correlation of the expression of CD11c and GFP (CSF1R) in single microglial cells in the hippocampus of prion disease mice, measured as relative intensity. D, Effect of AraC or saline (vehicle) on the morphology of GFP+ microglial cells of the hippocampus of prion (ME7) or control (NBH) mice. E, Effect of AraC or saline (vehicle) on the deposition of PrPSc (PrPSc+ plaques, left) and the degeneration of neurons (Fluoro Jade C-positive neurons, green, representative images, right) in the CA1 layer of the hippocampus of prion mice (ME7). Quantified data expressed as mean ± SEM of number of PrPSc+ plaques per square millimeter or Fluoro Jade C+ neurons in CA1. *p < 0.05, **p < 0.01, ***p < 0.001. Data were analyzed with a two-way ANOVA and a post hoc Tukey test (n = 4). A, B, Nuclei are stained with Hoechst (blue). A–C, Fluorescent sections evaluated with confocal microscopy. D, 2D projections of 3D stacks under confocal microscopy. Scale bars: A, 200 μm; B, E, 20 μm; D, 10 μm.
Figure 5.
Effect of the inhibition of CSF1R on microglial proliferation, inflammatory activation, and neuronal degeneration during prion disease. Effect of the inhibition of the signaling of CSF1R by GW2580 on microglial proliferation (A, B), inflammatory activation (C), and neuropathology (D) of prion disease mice (ME7+GW2580) compared with control (NBH) or prion mice treated with vehicle (ME7+vehicle). A, Analysis of microglial proliferation by immunohistochemistry for CD11b (microglia, red, representative images) and BrDU in the hippocampus of prion disease treated with GW2580 (ME7+GW2580) or vehicle (ME7+Vehicle) and control (NBH) mice. Quantified data expressed as mean±SEM of the number of CD11b+ or BrDU+ cells/mm2. B, C, Analysis of the expression of mRNA of CSF1R, PU.1, C/EBPa, cyclin D1, and cyclin D2 (B) and IL1b, IL6, MHCII, ARG1, and YM1 (C) in the hippocampus (CA1) of prion disease treated with GW2580 (ME7+GW2580) or vehicle (ME7+Vehicle) and control (NBH) mice. B, C, mRNA expression is represented as mean ± SEM and indicated as relative expression levels using the 2ΔΔCt method. D, Effect of GW2580 or vehicle on the degeneration of neurons (Fluoro Jade C-positive neurons, green) in the CA1 layer of the hippocampus of prion (ME7) or control (NBH) mice. Quantified data expressed as mean ± SEM of number of Fluoro Jade C+ neurons in CA1. *p < 0.05, **p < 0.01, ***p < 0.001. Data were analyzed with a one-way ANOVA and a post hoc Tukey test (B, C) or a two-tailed t test (A, D), n = 4. Scale bars: 20 μm.
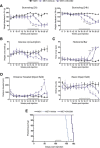
Figure 6.
Effect of the inhibition of microglial proliferation over the progression of prion disease. Effect of the inhibition of the signaling of CSF1R by GW2580 on the behavioral performance (A–D) and survival (E) of prion disease mice (ME7+GW2580) compared with control (NBH) or prion mice treated with vehicle (ME7+vehicle). A, Effect of the different treatments on the burrowing behavior, measured as weight displaced (in grams) off the tube in 2 or 24 h. B, Effect of the different treatments on the glucose consumption, measured as weight consumed (in grams) of 5% glucose in water. C, Effect of the different treatments on the motor performance, measured as time spent (in seconds) on the horizontal bar test. D, Effect of the different treatments on the locomotor activity, measured as distance traveled (cm) and number of rears (vertical counts) in the open field test. E, Effect of the different treatments on the survival, analyzed in a Kaplan–Meier curve. *p < 0.05, **p < 0.01, ***p < 0.001, ****p < 0.0001. Data were analyzed with a two-way ANOVA and a post hoc Tukey test (A–D) or with the comparison of the survival curves with a Mantel-Cox test (E); n = 8.
Figure 7.
Expression of the microglial proliferation regulatory proteins in variant Creutzfeldt–Jakob disease and Alzheimer disease. A–C, Immunohistochemical analysis of the expression of IL34 (A), PU.1 (B), and C/EBPa (C) in the white and gray matter of the temporal cortex of vCJD and AD brains compared with age-matched controls (CTL; representative images). Quantification data expressed as mean ± SEM of the number of IL34+ (D), PU.1+ (E), or C/EBPa+ (F) cells per square millimeters. G, H, Immunohistochemical analysis of the expression of Ki67 (marker of proliferation, G) in microglial cells (Iba1+, G) and IL34 (H) in astrocytes (GFAP+, H) in the temporal cortex of vCJD brains. A–C, Nuclei are stained with H/E (blue). G, H, Fluorescent sections evaluated with confocal microscopy. *p < 0.05, **p < 0.01, ****p < 0.0001, expressed versus the correspondent age-matched control. Data were analyzed with a two-way ANOVA and a post hoc Tukey test (n = 9–10). Scale bars: A–C, G, H (in A, G, H), 100 μm.
Similar articles
- Inhibition of IL-34 Unveils Tissue-Selectivity and Is Sufficient to Reduce Microglial Proliferation in a Model of Chronic Neurodegeneration.
Obst J, Simon E, Martin-Estebane M, Pipi E, Barkwill LM, Gonzalez-Rivera I, Buchanan F, Prescott AR, Faust D, Fox S, Brownlees J, Taylor D, Perry VH, Nuthall H, Atkinson PJ, Karran E, Routledge C, Gomez-Nicola D. Obst J, et al. Front Immunol. 2020 Oct 8;11:579000. doi: 10.3389/fimmu.2020.579000. eCollection 2020. Front Immunol. 2020. PMID: 33162994 Free PMC article. - Pharmacological targeting of CSF1R inhibits microglial proliferation and prevents the progression of Alzheimer's-like pathology.
Olmos-Alonso A, Schetters ST, Sri S, Askew K, Mancuso R, Vargas-Caballero M, Holscher C, Perry VH, Gomez-Nicola D. Olmos-Alonso A, et al. Brain. 2016 Mar;139(Pt 3):891-907. doi: 10.1093/brain/awv379. Epub 2016 Jan 8. Brain. 2016. PMID: 26747862 Free PMC article. - CSF1R inhibitor JNJ-40346527 attenuates microglial proliferation and neurodegeneration in P301S mice.
Mancuso R, Fryatt G, Cleal M, Obst J, Pipi E, Monzón-Sandoval J, Ribe E, Winchester L, Webber C, Nevado A, Jacobs T, Austin N, Theunis C, Grauwen K, Daniela Ruiz E, Mudher A, Vicente-Rodriguez M, Parker CA, Simmons C, Cash D, Richardson J; NIMA Consortium; Jones DNC, Lovestone S, Gómez-Nicola D, Perry VH. Mancuso R, et al. Brain. 2019 Oct 1;142(10):3243-3264. doi: 10.1093/brain/awz241. Brain. 2019. PMID: 31504240 Free PMC article. - Microglial activation and its implications in the brain diseases.
Dheen ST, Kaur C, Ling EA. Dheen ST, et al. Curr Med Chem. 2007;14(11):1189-97. doi: 10.2174/092986707780597961. Curr Med Chem. 2007. PMID: 17504139 Review. - Ion channels on microglia: therapeutic targets for neuroprotection.
Skaper SD. Skaper SD. CNS Neurol Disord Drug Targets. 2011 Feb;10(1):44-56. doi: 10.2174/187152711794488638. CNS Neurol Disord Drug Targets. 2011. PMID: 21143139 Review.
Cited by
- Targeting neuroinflammation in Alzheimer's disease: from mechanisms to clinical applications.
Si ZZ, Zou CJ, Mei X, Li XF, Luo H, Shen Y, Hu J, Li XX, Wu L, Liu Y. Si ZZ, et al. Neural Regen Res. 2023 Apr;18(4):708-715. doi: 10.4103/1673-5374.353484. Neural Regen Res. 2023. PMID: 36204826 Free PMC article. Review. - Enhanced phagocytosis associated with multinucleated microglia via Pyk2 inhibition in an acute β-amyloid infusion model.
Lee JW, Mizuno K, Watanabe H, Lee IH, Tsumita T, Hida K, Yawaka Y, Kitagawa Y, Hasebe A, Iimura T, Kong SW. Lee JW, et al. J Neuroinflammation. 2024 Aug 6;21(1):196. doi: 10.1186/s12974-024-03192-7. J Neuroinflammation. 2024. PMID: 39107821 Free PMC article. - Delivery of iPS-NPCs to the Stroke Cavity within a Hyaluronic Acid Matrix Promotes the Differentiation of Transplanted Cells.
Lam J, Lowry WE, Carmichael ST, Segura T. Lam J, et al. Adv Funct Mater. 2014 Nov 26;24(44):7053-7062. doi: 10.1002/adfm.201401483. Adv Funct Mater. 2014. PMID: 26213530 Free PMC article. - A roadmap for investigating the role of the prion protein in depression associated with neurodegenerative disease.
Beckman D, Linden R. Beckman D, et al. Prion. 2016 Mar 3;10(2):131-42. doi: 10.1080/19336896.2016.1152437. Prion. 2016. PMID: 27057694 Free PMC article. - Role of dietary phenols in mitigating microglia-mediated neuroinflammation.
Rangarajan P, Karthikeyan A, Dheen ST. Rangarajan P, et al. Neuromolecular Med. 2016 Sep;18(3):453-64. doi: 10.1007/s12017-016-8430-x. Epub 2016 Jul 27. Neuromolecular Med. 2016. PMID: 27465151 Review.
References
- Ajami B, Bennett JL, Krieger C, Tetzlaff W, Rossi FM. Local self-renewal can sustain CNS microglia maintenance and function throughout adult life. Nat Neurosci. 2007;10:1538–1543. - PubMed
- Boche D, Cunningham C, Docagne F, Scott H, Perry VH. TGFbeta1 regulates the inflammatory response during chronic neurodegeneration. Neurobiol Dis. 2006;22:638–650. - PubMed
Publication types
MeSH terms
Substances
LinkOut - more resources
Full Text Sources
Other Literature Sources
Medical
Molecular Biology Databases
Miscellaneous


