An inhibitor of the protein kinases TBK1 and IKK-ɛ improves obesity-related metabolic dysfunctions in mice - PubMed (original) (raw)
doi: 10.1038/nm.3082. Epub 2013 Feb 10.
Shian-Huey Chiang, Stuart J Decker, Louise Chang, Maeran Uhm, Martha J Larsen, John R Rubin, Jonathan Mowers, Nicole M White, Irit Hochberg, Michael Downes, Ruth T Yu, Christopher Liddle, Ronald M Evans, Dayoung Oh, Pingping Li, Jerrold M Olefsky, Alan R Saltiel
Affiliations
- PMID: 23396211
- PMCID: PMC3594079
- DOI: 10.1038/nm.3082
An inhibitor of the protein kinases TBK1 and IKK-ɛ improves obesity-related metabolic dysfunctions in mice
Shannon M Reilly et al. Nat Med. 2013 Mar.
Abstract
Emerging evidence suggests that inflammation provides a link between obesity and insulin resistance. The noncanonical IκB kinases IKK-ɛ and TANK-binding kinase 1 (TBK1) are induced in liver and fat by NF-κB activation upon high-fat diet feeding and in turn initiate a program of counterinflammation that preserves energy storage. Here we report that amlexanox, an approved small-molecule therapeutic presently used in the clinic to treat aphthous ulcers and asthma, is an inhibitor of these kinases. Treatment of obese mice with amlexanox elevates energy expenditure through increased thermogenesis, producing weight loss, improved insulin sensitivity and decreased steatosis. Because of its record of safety in patients, amlexanox may be an interesting candidate for clinical evaluation in the treatment of obesity and related disorders.
Figures
Figure 1. Induction of IKKε and TBK1 in obese mice is a result of increased inflammation
(a) TBK1 (left panel) and IKKε (right panel) activity in liver and WAT of mice fed ND (grey bars) or HFD (white bars). (_n_=4 per group). * P value < 0.05 ND versus HFD; # P value < 0.1 ND versus HFD. (b) Expression of Ikbke and Tbk1 in differentiated 3T3-L1 cells without treatment (white bars), treated with TNF-α (black bars), compound VIII (light grey bars) or both TNF-α and compound VIII (dark grey bars). Results are representative of multiple experiments. * P value < 0.05 no treatment versus TNF-α only treatment. † P value < 0.05 TNF-α versus TNF-α + compound VIII. (c) IKKε, TBK1 and PPARγ protein levels and TBK1 phosphorylation at Ser172 after TNF-α treatment. Results were replicated in more than three experiments. Akt is a loading control. (d) Ikbke expression in liver and WAT of mice on ND (grey bars) or HFD with (black bars) and without (white bars) ω-3 fatty acids (FA). † P value < 0.05 ND versus HFD. * P value < 0.05 HFD versus HFD + ω-3 FA. (_n_=9 per group). (e) IKKε protein levels and TBK1 phosphorylation at Ser172 in HFD mice with and without ω-3 FA. RalA is a loading control. (f) Ikbke expression levels in adipocytes and stromal vascular fraction of mice fed HFD (white bars) or HFD plus rosiglitazone (black bars). * P value <0.05 HFD versus HFD plus rosiglitazone. (_n_=8 in HFD group, _n_=4 in HFD plus rosiglitazone group).
Figure 2. Amlexanox is a specific inhibitor of IKKε and TBK1
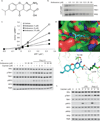
(a) Stick diagram of amlexanox structure. (b) Dose response of amlexanox inhibition of IKKε and TBK1 activity as determined by MBP phosphorylation showing an IC50 of approximately 1–2 µM. Results were replicated in more than three experiments. (c) Lineweaver-Burke plot demonstrating competition of amlexanox with ATP for inhibition of IKKε. Results are representative of multiple experiments. (d) Model of amlexanox binding to the ATP binding site of TBK1; top panel: Surface model showing the binding of amlexanox in the active site of TBK1; bottom panel: Hydrogen bonding of amlexanox (cyan) in the active site of TBK1. (e) TBK1 phosphorylation at Ser172 and IRF3 phosphorylation at ser396 in 3T3-L1 adipocytes treated with amlexanox or cayman with and without poly I:C. Results were replicated in multiple experiments. RalA is a loading control. (f) IRF3, IKKβ and TBK1 phosphorylation in RAW264.7 cells treated with cayman, LPS and poly I:C. Results were replicated in multiple experiments. RalA is a loading control.
Figure 3. Daily amlexanox gavage both prevents and reverses diet-induced or genetic obesity
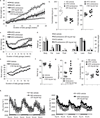
(a) Body weight of mice treated preventatively with amlexanox 25 mg per kg (grey squares) 100 mg per kg (black squares) or vehicle control (white squares = HFD, white circles = ND) (_n_=5 per group). (b) Food intake after one week treatment (left panel) or six weeks preventative gavage (right panel) ND vehicle (grey circles) HFD amlexanox (black squares) or HFD vehicle (white squares). (n = 5–7 per group) (c) Body weight of treatment group: amlexanox (black squares) or vehicle control (white squares). Mice maintained on ND and gavaged with vehicle control are also shown (white circles). (_n_=7 per group). (d) Body weight of mice treated preventatively with amlexanox (black squares) or vehicle control (white squares), treatment withdrawn after eight weeks (black Xs) (_n_=7 per group). (e) Total (left panel) and relative (right panel) fat and lean body mass of mice in treatment group. ND vehicle control: light grey bars, ND amlexanox: dark grey bars, HFD vehicle control: white bars and HFD amlexanox: black bars. (_n_=4 for ND groups, _n_=8 for HFD groups). (f) Body weight of ob/ob mice gavaged with amlexanox (black diamonds) or vehicle control (white diamonds) (_n_=8 per group). (g) Total body fat mass of ob/ob mice gavaged with amlexanox (black bars) or vehicle control (white bars) (_n_=6 per goup). (h) Serum adiponectin levels in ob/ob mice gavaged with amlexanox (black bars) or vehicle control (white bars). (_n_=8 per group). (i) Oxygen consumption (VO2) of mice in treatment group; ND (left panel – light grey circles = vehicle, dark grey circles = amlexanox) and HFD (right panel – white squares = vehicle, black squares = amlexanox). (_n_=4 for ND groups, _n_=8 for HFD groups). HFD amlexanox treated mean values are significantly higher than HFD vehicle mean values during all three light and dark cycles, P value < 0.05. (j) Core body temperature in ND mice gavaged with vehicle (grey bar), HFD mice gavaged with vehicle (white bar) or amlexanox (black bar). * P value < 0.05 HFD vehicle control versus HFD amlexanox treated or ob/ob vehicle control versus ob/ob amlexanox treated. † P value < 0.05 ND vehicle control versus HFD vehicle control.
Figure 4. Amlexanox treatment improves insulin sensitivity and glucose tolerance
(a) Oral glucose tolerance test in preventative group. Vehicle control (ND-white circles, HFD-white squares), HFD amlexanox (black squares). (_n_=5 per group). (b) Fasting blood glucose and serum insulin levels in treatment group: ND vehicle control (grey bars), HFD vehicle control (white bars) and HFD amlexanox treated (black bars). (_n_=8 per group). (c) Insulin tolerance test of treatment group. ND vehicle control (white circles), ND amlexanox (black circles), HFD vehicle control (white squares) HFD amlexanox (black squares). (_n_=8 per group). (d) Oral glucose tolerance test of ob/ob mice gavaged with amlexanox (black diamonds) or vehicle control (white diamonds) (_n_=8 per group). (e) Insulin tolerance test in ob/ob mice gavaged with amlexanox (black diamonds) or vehicle control (white diamonds). (_n_=8 per group). (f–i) Hyperinsulinemic euglycemic clamp in amlexanox (50 mg per kg-black bars) and vehicle (white bars) treated HFD mice (_n_=9 per group) (f) Area under the curve for glucose infusion rate during clamp. (g) Hepatic glucose production before and after the clamp (left panel) and percent suppression of hepatic glucose production (right panel). (h) Glucose turnover rate during the clamp. (i) Fold suppression of serum free fatty acid (FFA) levels during the clamp. * P value < 0.05 HFD vehicle control versus HFD amlexanox treated, or ob/ob vehicle control versus ob/ob amlexanox treated. † P value <0.05 ND vehicle control versus HFD vehicle control
Figure 5. Amlexanox treatment reverses hepatic steatosis
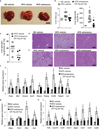
(a) Macroscopic pictures of the liver; left: ND vehicle control, middle: HFD vehicle control; right: HFD gavaged daily with amlexanox (scale bar = 1 cm). (b) Total liver weight (left panel) and triglyceride content (right panel) of mice on ND (grey bars) or HFD gavaged with vehicle (white bars) or amlexanox (black bars). (_n_=6 per group). (c) Liver glycogen content in HFD mice treated with amlexanox (black bars) or vehicle (white bars). (_n_=5 per group). (d,e) Representative images of hematoxylin and eosin (H and E)-stained liver (scale bars = 2 mm). (d) left: ND vehicle control, middle: HFD vehicle control; right: HFD treated with amlexanox. (e) left: HFD vehicle control, middle: HFD treated with amlexanox; right: HFD amlexanox withdrawal for ten weeks after eight weeks treatment. Expression of (f) lipid metabolism genes, (g) glucose metabolism genes, and (h) inflammatory genes and macrophage markers in livers of mice in treatment group. (f–h) Grey bars: ND vehicle control, white bars: HFD vehicle control; black bars: HFD gavaged daily with amlexanox (_n_=6 per group). All amlexanox treatment are daily gavage. * P value < 0.05 HFD vehicle control versus HFD amlexanox treated; † P value < 0.05 ND vehicle control versus HFD vehicle control; # P value < 0.1 ND vehicle control versus HFD vehicle control.
Figure 6. Amlexanox reduces inflammation and increases energy expenditure in adipose tissue
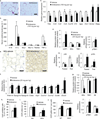
(a) Representative images of H and E-stained sections from WAT of ob/ob mice treated with vehicle control (left panel) or amlexanox (right panel) (scale bars = 1 mm) (b) Expression of inflammatory genes and macrophage markers in WAT from ob/ob mice gavaged with vehicle control (white bars) or amlexanox (black bars) (_n_=6 per group). (c) Serum cytokine levels in ob/ob mice gavaged with vehicle control (white bars) or amlexanox (black bars). (_n_=6 per group). (d) Quantified protein and phosphorylation levels in WAT from mice treated with amlexanox (back bars) or vehicle control (white bars) western blot–Supplementary Fig. 5b, online. (e) BAT stained for UCP1 protein levels in HFD vehicle control (left) and amlexanox treated mice (right) (scale bars = 200 µm). (f) Expression of BAT specific markers in BAT; white bars: HFD vehicle control; black bars: HFD treated with amlexanox (_n_=8 per group). (g) Quantified protein and phosphorylation levels in BAT from mice treated with amlexanox (black bars) or vehicle control (white bars) western blot–Supplementary Fig. 5h, online. (h) Lipid oxidation rate in ex vivo BAT treated with amlexanox (black bar) or vehicle control (white bar). (_n_=6 per group). (i) Oxygen consumption rate in ex vivo BAT from ND and HFD mice treated with amlexanox (black bars) or vehicle control (white bars) (_n_=5 per group). (j) Oxygen consumption rate in WT and Ikbke/Tbk1 double KO (DKO) MEFs treated with amlexanox (black bars) or vehicle control (white bars). (_n_=5 wells per group). * P value < 0.05 vehicle control versus amlexanox treated.
Comment in
- Obesity: Teaching an old drug new tricks--amlexanox targets inflammation to improve metabolic dysfunction.
Koch L. Koch L. Nat Rev Endocrinol. 2013 Apr;9(4):185. doi: 10.1038/nrendo.2013.42. Epub 2013 Feb 26. Nat Rev Endocrinol. 2013. PMID: 23438840 No abstract available. - Turning off the inflammatory, but not the metabolic, flames.
Calay ES, Hotamisligil GS. Calay ES, et al. Nat Med. 2013 Mar;19(3):265-7. doi: 10.1038/nm.3114. Nat Med. 2013. PMID: 23467233 No abstract available. - Metabolic disorders: Breaking the links between inflammation and diabetes.
Crunkhorn S. Crunkhorn S. Nat Rev Drug Discov. 2013 Apr;12(4):261. doi: 10.1038/nrd3988. Epub 2013 Mar 15. Nat Rev Drug Discov. 2013. PMID: 23493085 No abstract available.
Similar articles
- Loss of Tbk1 kinase activity protects mice from diet-induced metabolic dysfunction.
Cruz VH, Arner EN, Wynne KW, Scherer PE, Brekken RA. Cruz VH, et al. Mol Metab. 2018 Oct;16:139-149. doi: 10.1016/j.molmet.2018.06.007. Epub 2018 Jun 11. Mol Metab. 2018. PMID: 29935921 Free PMC article. - Dual TBK1/IKKε inhibitor amlexanox mitigates palmitic acid-induced hepatotoxicity and lipoapoptosis in vitro.
Zhou Z, Qi J, Lim CW, Kim JW, Kim B. Zhou Z, et al. Toxicology. 2020 Nov;444:152579. doi: 10.1016/j.tox.2020.152579. Epub 2020 Sep 6. Toxicology. 2020. PMID: 32905826 - Design, synthesis, and biological activity of substituted 2-amino-5-oxo-5H-chromeno[2,3-b]pyridine-3-carboxylic acid derivatives as inhibitors of the inflammatory kinases TBK1 and IKKε for the treatment of obesity.
Beyett TS, Gan X, Reilly SM, Gomez AV, Chang L, Tesmer JJG, Saltiel AR, Showalter HD. Beyett TS, et al. Bioorg Med Chem. 2018 Nov 1;26(20):5443-5461. doi: 10.1016/j.bmc.2018.09.020. Epub 2018 Sep 20. Bioorg Med Chem. 2018. PMID: 30270002 Free PMC article. - Mutual regulation of metabolic processes and proinflammatory NF-κB signaling.
Kracht M, Müller-Ladner U, Schmitz ML. Kracht M, et al. J Allergy Clin Immunol. 2020 Oct;146(4):694-705. doi: 10.1016/j.jaci.2020.07.027. Epub 2020 Aug 6. J Allergy Clin Immunol. 2020. PMID: 32771559 Review. - Are the IKKs and IKK-related kinases TBK1 and IKK-epsilon similarly activated?
Chau TL, Gioia R, Gatot JS, Patrascu F, Carpentier I, Chapelle JP, O'Neill L, Beyaert R, Piette J, Chariot A. Chau TL, et al. Trends Biochem Sci. 2008 Apr;33(4):171-80. doi: 10.1016/j.tibs.2008.01.002. Epub 2008 Mar 18. Trends Biochem Sci. 2008. PMID: 18353649 Review.
Cited by
- Recent Advances in Pain Management: Relevant Protein Kinases and Their Inhibitors.
Giraud F, Pereira E, Anizon F, Moreau P. Giraud F, et al. Molecules. 2021 May 4;26(9):2696. doi: 10.3390/molecules26092696. Molecules. 2021. PMID: 34064521 Free PMC article. Review. - Integrated bioinformatics analysis reveals novel key biomarkers and potential candidate small molecule drugs in gestational diabetes mellitus.
Alur V, Raju V, Vastrad B, Tengli A, Vastrad C, Kotturshetti S. Alur V, et al. Biosci Rep. 2021 May 28;41(5):BSR20210617. doi: 10.1042/BSR20210617. Biosci Rep. 2021. PMID: 33890634 Free PMC article. - Drug Discovery Strategies for Inherited Retinal Degenerations.
Das A, Imanishi Y. Das A, et al. Biology (Basel). 2022 Sep 10;11(9):1338. doi: 10.3390/biology11091338. Biology (Basel). 2022. PMID: 36138817 Free PMC article. Review. - Gentiana scabra Restrains Hepatic Pro-Inflammatory Macrophages to Ameliorate Non-Alcoholic Fatty Liver Disease.
Zheng Y, Fang D, Huang C, Zhao L, Gan L, Chen Y, Liu F. Zheng Y, et al. Front Pharmacol. 2022 Jan 18;12:816032. doi: 10.3389/fphar.2021.816032. eCollection 2021. Front Pharmacol. 2022. PMID: 35115947 Free PMC article. - Advances in IKBKE as a potential target for cancer therapy.
Yin M, Wang X, Lu J. Yin M, et al. Cancer Med. 2020 Jan;9(1):247-258. doi: 10.1002/cam4.2678. Epub 2019 Nov 15. Cancer Med. 2020. PMID: 31733040 Free PMC article. Review.
References
- Taniguchi CM, Emanuelli B, Kahn CR. Critical nodes in signalling pathways: insights into insulin action. Nat Rev Mol Cell Biol. 2006;7:85–96. - PubMed
- Reaven GM. The insulin resistance syndrome: definition and dietary approaches to treatment. Annual review of nutrition. 2005;25:391–406. - PubMed
- Reaven GM. Why Syndrome X? From Harold Himsworth to the insulin resistance syndrome. Cell metabolism. 2005;1:9–14. - PubMed
- Stumvoll M, Goldstein BJ, van Haeften TW. Type 2 diabetes: principles of pathogenesis and therapy. Lancet. 2005;365:1333–1346. - PubMed
- Biddinger SB, Kahn CR. From mice to men: insights into the insulin resistance syndromes. Annual review of physiology. 2006;68:123–158. - PubMed
Publication types
MeSH terms
Substances
Grants and funding
- 60591/PHS HHS/United States
- F30DK089687/DK/NIDDK NIH HHS/United States
- UL1-RR024986/RR/NCRR NIH HHS/United States
- P30 DK089503/DK/NIDDK NIH HHS/United States
- P60 DK020572/DK/NIDDK NIH HHS/United States
- R01 DK060597/DK/NIDDK NIH HHS/United States
- DK020572/DK/NIDDK NIH HHS/United States
- R01 DK060591/DK/NIDDK NIH HHS/United States
- R24 DK090962/DK/NIDDK NIH HHS/United States
- DK089503/DK/NIDDK NIH HHS/United States
- R01 DK061618/DK/NIDDK NIH HHS/United States
- F32DK09685101/DK/NIDDK NIH HHS/United States
- P30 DK063491/DK/NIDDK NIH HHS/United States
- T32 GM008322/GM/NIGMS NIH HHS/United States
- P30 DK020572/DK/NIDDK NIH HHS/United States
- F30 DK089687/DK/NIDDK NIH HHS/United States
- R24DK090962/DK/NIDDK NIH HHS/United States
- UL1 RR024986/RR/NCRR NIH HHS/United States
- F32 DK096851/DK/NIDDK NIH HHS/United States
- DK60597/DK/NIDDK NIH HHS/United States
- HHMI/Howard Hughes Medical Institute/United States
LinkOut - more resources
Full Text Sources
Other Literature Sources
Medical
Molecular Biology Databases
Miscellaneous


