miR-29a inhibition normalizes HuR over-expression and aberrant AU-rich mRNA stability in invasive cancer - PubMed (original) (raw)
miR-29a inhibition normalizes HuR over-expression and aberrant AU-rich mRNA stability in invasive cancer
Wijdan Al-Ahmadi et al. J Pathol. 2013 May.
Free PMC article
Abstract
The activities of RNA-binding proteins are perturbed in several pathological conditions, including cancer. These proteins include tristetraprolin (TTP, ZFP36) and HuR (ELAVL1), which respectively promote the decay or stability of adenylate-uridylate-rich (AU-rich) mRNAs. Here, we demonstrated that increased stabilization and subsequent over-expression of HuR mRNA were coupled to TTP deficiency. These findings were observed in breast cancer cell lines with an invasive phenotype and were further confirmed in ZFP36-knockout mouse fibroblasts. We show that TTP-HuR imbalance correlated with increased expression of AU-rich element (ARE) mRNAs that code for cancer invasion genes. The microRNA miR-29a was abundant in invasive breast cancer cells when compared to non-tumourigenic cell types. When normal breast cells were treated with miR-29a, HuR mRNA and protein expression were up-regulated. MiR-29a recognized a seed target in the TTP 3' UTR and a cell-permeable miR-29a inhibitor increased TTP activity towards HuR 3' UTR. This led to HuR mRNA destabilization and restoration of the aberrant TTP-HuR axis. Subsequently, the cancer invasion factors uPA, MMP-1 and MMP-13, and cell invasiveness, were decreased. The TTP:HuR mRNA ratios were also perturbed in samples from invasive breast cancer patients when compared with normal tissues, and were associated with invasion gene expression. This study demonstrates that an aberrant ARE-mediated pathway in invasive cancer can be normalized by targeting the aberrant and functionally coupled TTP-HuR axis, indicating a potential therapeutic approach.
Copyright © 2013 Pathological Society of Great Britain and Ireland. Published by John Wiley & Sons, Ltd.
Figures
Figure 1
TTP:HuR ratio in invasive breast cancer. (A) HuR mRNA expression profile in normal and tumour breast cell lines. TaqMan assays for human HuR were performed and normalized to human GAPDH: values are mean ± SEM from three independent experiments; *p < 0.05 (one-way ANOVA), **p < 0.005 (Student′s _t_-test). (B) TTP:HuR mRNA expression ratio. RNA samples in (A) were also used for quantification of TTP, using TaqMan and normalized to human GAPDH. The ratio of TTP to HuR mRNA was then calculated; ***p < 0.001 (Student′s _t_-test). One-way ANOVA was also computed. (C) Comparison of TTP:HuR mRNA expression ratio of different breast carcinoma samples versus normal matched breast tissue obtained from TCGA data, using the Oncomine portal; ***p < 0001 (Student′s _t_-test) in comparison with normal sample values; Unc, not classified. (D) TTP and HuR protein levels in MCF10A and MDA-MB-231 cells. (E) HuR mRNA decay curve in MDA-MB-231 and MCF10A cells. The mRNA half-lives were calculated using the one-phase exponential decay model. The data are from one experiment, representative of three independent experiments; _r_2, goodness of fit.
Figure 2
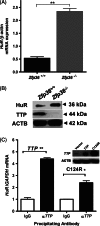
TTP regulation of HuR. (A) HuR mRNA expression in Zfp36+/+ and _Zfp36_−/− MEFs. TaqMan for mouse HuR was performed and normalized to _β_-actin: values are mean ± SEM from three independent experiments; **p < 0.005 (Student's _t_-test). (B) HuR and TTP protein expression in Zfp36+/+ and _Zfp36_−/− mouse fibroblasts, using western blotting. (C) Real-time PCR quantification of HuR mRNA associated with TTP protein. HEK293 cells were transfected with TTP or mutant TTP (C124R) expression plasmids, lysed and immunoprecipitated using anti-TTP or normal IgG control antibody. Quantification of physically associated HuR mRNA was performed by qPCR; *p < 0.05, **p < 0.005 (Student's _t_-test); (inset) western blotting of TTP and C124R expression.
Figure 3
miR-29a levels and effects on TTP–HuR axis (A) miR-29a expression profile in normal and tumour breast cell lines. TaqMan expression assays for hsa-miR-29a were performed and normalized to RNU48 as the endogenous control: values represent mean ± SEM from three independent experiments; *p < 0.05 (Student′s _t_-test); ***p < 0.001 (one-way ANOVA). (B) Effect of miR-29a on TTP and HuR mRNA expression. MCF10A normal-like cells were transfected with miR-29a precursor hairpin or control for 24 h; qPCR for TTP and HuR was performed: ***p < 0.001 (two-way ANOVA); *p < 0.05, ***p < 0.001 (Student′s _t_-test); (Lower panel) TTP:HuR mRNA ratio. (C) Western blots for HuR and control _β_-tubulin proteins in MCF-10A cells with or without miR-29a (pre-miR) precursor. (D) Schematic representation of the RPS30-EGFP-control 3′ UTR and RPS30-EGFP-TTP 3′ UTR reporter constructs; arrow points to the regions of the TTP 3′ UTR deleted by cloning-free reporter construction. (E) Regulation of TTP 3′ UTR reporter expression by miR-29a mimic in HEK293 cells. GFP fluorescence was measured 24 h post-transfection; ***p < 0.001 (Student′s _t_-test). Two-way ANOVA is also shown. (F) HEK293 cells transfected with 100 ng expression constructs comprising either miR-29a site + ARE region, miR-29a site alone or miR-29a and ARE-deleted regions. The miR-29a mimic or mimic control (each at 12.5 n
m
concentration) was co-transfected with the indicated constructs and GFP fluorescence measured after 48 h; ***p < 0.0001 (Student′s _t_-test).
Figure 4
Normalization of TTP–HuR imbalance by the miR-29a inhibitor. (A) Knockdown efficiency of the cell-permeable miR-29a PNA inhibitor on miR-29a levels in MDA-MB-231breast cancer cells by qRT–PCR. (B) Effects of miR-29a inhibition on TTP and HuR mRNA expression in MDA-MB-231 cells by qRT–PCR; ***p < 0.001 (two-way ANOVA); *p < 0.05, ***p < 0.001 (Student′s _t_-test); (inset) TTP:HuR mRNA ratio for the control and miR-29a inhibited samples; ***p < 0.001 (Student′s _t_-test). (C, D) mRNA decay curves for TTP and HuR in MDA-MB-231 cells; curves, fitted using the one-phase exponential decay model, are from one experiment representative of at least two independent experiments; _r_2, goodness of fit. (E) Effect of miR-29a inhibition on HuR mRNA expression. MDA-MB-231 cells were treated with miR-29a inhibitor or control for 48 h, then TTP protein was immunoprecipitated with anti-TTP or IgG control antibody; HuR mRNA physically associated with TTP–anti-TTP complex was quantified by qPCR; **p < 0.01 (two-way ANOVA); *p < 0.05, ***p < 0.0001 (Student′s _t_-test). (F) Effect of miR-29a inhibition on HuR 3′ UTR luciferase reporter activity. MDA-MB-231 cells were treated with miR-29a inhibitor or control for 48 h, then transfected with an RPS30-Luc-HuR 3′ UTR reporter plasmid or control plasmid. Luciferase activity was measured after 24 h; ***p < 0.001 (Student's _t_-test).
Figure 5
Phenotypic changes and invasion of invasive breast cancer cells following miR-29a inhibition. (A) Confocal microscopy of TTP and HuR protein as a result of miR-29a inhibition. (B) Western blotting using antibodies against TTP, HuR and _β_-actin as a loading control. (C, D) Effects of miR-29a inhibition and HuR knockdown on invasiveness of breast cancer cells: (upper panel) representative western blot of HuR siRNA knockdown efficiency. (E) Effect of miR-29a inhibitor on F-actin polymerization in breast cancer cells detected with phalloidin: (lower panel) graphical representation of fluorescence intensity.
Figure 6
TTP–HuR balance modulation and pro-invasion/migration genes in cells and patient tissues. (A) mRNA expression for uPA, MMP-1 and MMP-13 pro-invasion factors in MDA-MB-231 cells treated with miR-29a inhibitor or control; ***p < 0.005 (Student's _t_-test). (B) Western blot of TTP and uPA protein expression normalized to _β_-tubulin endogenous loading control. (C) Heat map for TTP, HuR, uPA, MMP1 and MMP-13 in normal and invasive breast cancer patients, obtained from the TCGA database through the Oncomine web portal. (D) Graphical representation of pairwise correlation with TTP:HuR mRNA ratio in invasive breast cancer patients; level 2 gene expression data were obtained from TCGA data, using the Oncomine algorithm; ***p < 0.001, *p < 0.05 (Spearman's correlation).
Figure 7
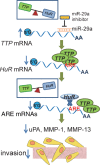
TTP–HuR pathway cascade following miR-29a inhibition. Inhibition of miR-29a relieves post-transcriptional repression of TTP; more TTP is produced that binds to and destabilizes HuR mRNA and other pro-cancer mRNAs. As a result, a normalized TTP–HuR balance is created, leading to enhanced ARE mRNA instability for factors involved in invasion and migration, such as uPA, MMP-1 and MMP-13 and a reduction in migration and invasion.
Comment in
- UTRly malignant: mRNA stability and the invasive phenotype in breast cancer.
Le Quesne J. Le Quesne J. J Pathol. 2013 Jun;230(2):129-31. doi: 10.1002/path.4175. Epub 2013 Mar 21. J Pathol. 2013. PMID: 23389914
Similar articles
- Posttranscriptional control of the chemokine receptor CXCR4 expression in cancer cells.
Al-Souhibani N, Al-Ghamdi M, Al-Ahmadi W, Khabar KS. Al-Souhibani N, et al. Carcinogenesis. 2014 Sep;35(9):1983-92. doi: 10.1093/carcin/bgu080. Epub 2014 Apr 1. Carcinogenesis. 2014. PMID: 24692066 Free PMC article. - Dysregulation of TTP and HuR plays an important role in cancers.
Wang H, Ding N, Guo J, Xia J, Ruan Y. Wang H, et al. Tumour Biol. 2016 Nov;37(11):14451-14461. doi: 10.1007/s13277-016-5397-z. Epub 2016 Sep 19. Tumour Biol. 2016. PMID: 27644249 Review. - The RNA-binding zinc-finger protein tristetraprolin regulates AU-rich mRNAs involved in breast cancer-related processes.
Al-Souhibani N, Al-Ahmadi W, Hesketh JE, Blackshear PJ, Khabar KS. Al-Souhibani N, et al. Oncogene. 2010 Jul 22;29(29):4205-15. doi: 10.1038/onc.2010.168. Epub 2010 May 24. Oncogene. 2010. PMID: 20498646 Free PMC article. - UTRly malignant: mRNA stability and the invasive phenotype in breast cancer.
Le Quesne J. Le Quesne J. J Pathol. 2013 Jun;230(2):129-31. doi: 10.1002/path.4175. Epub 2013 Mar 21. J Pathol. 2013. PMID: 23389914 - Role of the Tristetraprolin (Zinc Finger Protein 36 Homolog) Gene in Cancer.
Gupta G, Bebawy M, Pinto TJA, Chellappan DK, Mishra A, Dua K. Gupta G, et al. Crit Rev Eukaryot Gene Expr. 2018;28(3):217-221. doi: 10.1615/CritRevEukaryotGeneExpr.2018021188. Crit Rev Eukaryot Gene Expr. 2018. PMID: 30311568 Review.
Cited by
- Tristetraprolin inhibits the growth of human glioma cells through downregulation of urokinase plasminogen activator/urokinase plasminogen activator receptor mRNAs.
Ryu J, Yoon NA, Lee YK, Jeong JY, Kang S, Seong H, Choi J, Park N, Kim N, Cho WJ, Paek SH, Cho GJ, Choi WS, Park JY, Park JW, Kang SS. Ryu J, et al. Mol Cells. 2015;38(2):156-62. doi: 10.14348/molcells.2015.2259. Epub 2014 Dec 30. Mol Cells. 2015. PMID: 25556371 Free PMC article. - RNA binding proteins (RBPs) and their role in DNA damage and radiation response in cancer.
Mehta M, Raguraman R, Ramesh R, Munshi A. Mehta M, et al. Adv Drug Deliv Rev. 2022 Dec;191:114569. doi: 10.1016/j.addr.2022.114569. Epub 2022 Oct 14. Adv Drug Deliv Rev. 2022. PMID: 36252617 Free PMC article. Review. - Niclosamide improves cancer immunotherapy by modulating RNA-binding protein HuR-mediated PD-L1 signaling.
Zhang Q, Yang Z, Hao X, Dandreo LJ, He L, Zhang Y, Wang F, Wu X, Xu L. Zhang Q, et al. Cell Biosci. 2023 Oct 17;13(1):192. doi: 10.1186/s13578-023-01137-w. Cell Biosci. 2023. PMID: 37848943 Free PMC article. - Krüppel -like factor 8 is a stress-responsive transcription factor that regulates expression of HuR.
Govindaraju S, Lee BS. Govindaraju S, et al. Cell Physiol Biochem. 2014;34(2):519-32. doi: 10.1159/000363019. Epub 2014 Aug 8. Cell Physiol Biochem. 2014. PMID: 25116351 Free PMC article. - RNA binding protein, tristetraprolin in a murine model of recurrent pregnancy loss.
Khalaj K, Luna RL, de França ME, de Oliveira WH, Peixoto CA, Tayade C. Khalaj K, et al. Oncotarget. 2016 Nov 8;7(45):72486-72502. doi: 10.18632/oncotarget.12539. Oncotarget. 2016. PMID: 27732963 Free PMC article.
References
- Audic Y, Hartley RS. Post-transcriptional regulation in cancer. Biol Cell. 2004;96::479–498. - PubMed
Publication types
MeSH terms
Substances
LinkOut - more resources
Full Text Sources
Other Literature Sources
Medical
Miscellaneous


