PrPC controls via protein kinase A the direction of synaptic plasticity in the immature hippocampus - PubMed (original) (raw)
PrPC controls via protein kinase A the direction of synaptic plasticity in the immature hippocampus
Maddalena D Caiati et al. J Neurosci. 2013.
Abstract
The cellular form of prion protein PrP(C) is highly expressed in the brain, where it can be converted into its abnormally folded isoform PrP(Sc) to cause neurodegenerative diseases. Its predominant synaptic localization suggests a crucial role in synaptic signaling. Interestingly, PrP(C) is developmentally regulated and its high expression in the immature brain could be instrumental in regulating neurogenesis and cell proliferation. Here, PrP(C)-deficient (Prnp(0/0)) mice were used to assess whether the prion protein is involved in synaptic plasticity processes in the neonatal hippocampus. To this aim, calcium transients associated with giant depolarizing potentials, a hallmark of developmental networks, were transiently paired with mossy fiber activation in such a way that the two events were coincident. While this procedure caused long-term potentiation (LTP) in wild-type (WT) animals, it caused long-term depression (LTD) in Prnp(0/0) mice. Induction of LTP was postsynaptic and required the activation of cAMP-dependent protein kinase A (PKA) signaling. The induction of LTD was presynaptic and relied on G-protein-coupled GluK1 receptor and protein lipase C. In addition, at emerging CA3-CA1 synapses in WT mice, but not in Prnp(0/0) mice, pairing Schaffer collateral stimulation with depolarization of CA1 principal cells induced LTP, known to be PKA dependent. Postsynaptic infusion of a constitutively active isoform of PKA catalytic subunit Cα into CA1 and CA3 principal cells in the hippocampus of Prnp(0/0) mice caused a persistent synaptic facilitation that was occluded by subsequent pairing. These data suggest that PrP(C) plays a crucial role in regulating via PKA synaptic plasticity in the developing hippocampus.
Figures
Figure 1.
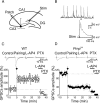
Pairing GDPs with MF stimulation induces LTP in WT mice and LTD in _Prnp_0/0 mice. A, Diagram of the hippocampus showing a CA3 pyramidal neuron receiving synaptic input from the MF. The stimulating electrode (stim) was positioned in stratum granulosum of the dentate gyrus. B, GDPs recorded from a CA3 principal cell in current-clamp mode; the inset below represents the GDP (asterisk) on an expanded time scale. Note the absence of spikes riding on top of GDPs because of the block of the sodium channel with intracellular QX 314. The rising phase of GDPs (between the dashed lines) was used to trigger synaptic stimulation (stim). C, The mean amplitude of MF-GPSCs recorded in WT animals (n = 13) before and after pairing (arrow at time 0) is plotted versus time, in the absence or in the presence (bars) of
l
-AP4 and picrotoxin (PTX). Insets above the graphs represent individual traces of GPSCs evoked before and after pairing, after addition of
l
-AP4 and PTX. D, As in C but from _Prnp_0/0 mice (n = 15). In this and in the following figures, vertical bars refer to SEM.
Figure 2.
Presynaptic expression of LTP and LTD in WT and _Prnp_0/0 mice. A, B, Summary plot (columns) of successes, CV−2, PPR of MF-GPSCs measured in individual cells before pairing (Control, white) and after pairing (Pairing, black) in WT (A) and in _Prnp_0/0 animals (B). ***p < 0.001.
Figure 3.
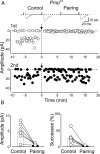
Pairing-induced synapse silencing in CA3 principal cells from _Prnp_0/0 mice. A, Amplitudes of synaptic responses (insets above graphs) evoked in a P4 CA3 principal cell by two stimuli (50 ms apart; open symbols, GPSCs evoked by first stimulus; closed symbols, GPSCs evoked by second stimulus) obtained before and after pairing (arrows at time 0) are plotted against time. B, Summary plots for six cells silenced after pairing. Amplitudes and successes measured in individual cells before pairing (Control, white columns) and after pairing (Pairing, black columns).
Figure 4.
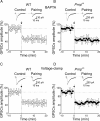
Loading the cells with BAPTA or maintaining them close to their resting values during pairing blocks LTP and reveals LTD in WT animals. A, C, Plot of mean MF-GPSCs amplitude from CA3 pyramidal cells loaded with BAPTA (n = 7; A) or voltage clamped at −70 mV (n = 6; C) before and after pairing (arrows at time 0) versus time. Insets above the graphs represent individual traces of GPSCs evoked before and after pairing. Note pairing-induced LTD instead of LTP. B, D, As in A and C but from _Prnp_0/0 mice (B, n = 7; D, n = 9).
Figure 5.
Presynaptic expression of pairing-induced LTD in CA3 pyramidal cells loaded with BAPTA. A, B, Summary plots of successes, CV−2, PPR of MF-GPSCs measured in individual cells before pairing (Control, white) and after pairing (Pairing, black) in WT (A, n = 7) and in _Prnp_0/0 animals (B, n = 7). *p < 0.05; **p < 0.01. As expected for a presynaptic type of action, pairing-induced LTD was associated with a significant reduction in success rate (WT mice, from 0.74 ± 0.06 to 0.42 ± 0.1, n = 7, p < 0.01; _Prnp_0/0 mice, from 0.67 ± 0.09 to 0.29 ± 0.1, n = 8, p < 0.01), a significant increase in PPR (WT mice, from 1.4 ± 0.1 to 2.1 ± 0.3, n = 5, p < 0.05; _Prnp_0/0 mice, from 1.1 ± 0.2 to 1.5 ± 0.3, n = 5, p < 0.05), and a marked decrease in CV−2 (WT mice, from 3 ± 0.67 to 2.3 ± 0.7, n = 7, p < 0.05; _Prnp_0/0 mice, 3.3 ± 1.4 to 1.8 ± 1.2, n = 6, p < 0.01).
Figure 6.
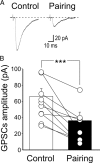
Inhibiting PKA in the postsynaptic neuron prevents pairing-induced LTP in WT mice. A, Sample traces of a P5 CA3 pyramidal cell (loaded with the membrane-impermeable PKA inhibitor PKI 6-22) obtained before pairing (Control) and 30 min after pairing. B, Summary plot of MF-GPSC amplitudes measured in individual cells loaded with PKI 6-22 before pairing (Control, white) and after pairing (Pairing, black). ***p < 0.001.
Figure 7.
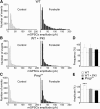
In WT but not in _Prnp_0/0 mice, forskolin enhances the amplitude of miniature GPSCs. A, Amplitude distribution of miniature GPSCs recorded in CA3 principal cells from WT animals under control conditions and during application of forskolin (n = 10). B, As in A but with the membrane-impermeable PKA inhibitor PKI 6-22 into the patch pipette (n = 8). C, As in A but from _Prnp_0/0 mice (n = 8). Note reduction of larger amplitude events with forskolin in B and C. Bin width, 5 pA. D, E, Summary plots of forskolin-induced increase in frequency (D) or in amplitude (E) of miniature GABAergic events in cells from WT animals (white columns), in cells from WT animals but loaded with PKI 6-22 (gray columns), or in cells from _Prnp_0/0 mice (black columns). ***p < 0.001 (respect to prepairing values, paired t test); values for WT plus PKI and _Prnp_0/0 versus WT were significantly different (p < 0.001, 1-way ANOVA).
Figure 8.
Postsynaptic application of the catalytic subunit of PKA (Cα) induces MF-GPSC facilitation in the hippocampus of _Prnp_0/0 mice. Infusion of the constitutively active isoform of PKA catalytic subunit Cα into CA3 pyramidal neurons via the patch pipette progressively enhanced the amplitude of MF-GPSCs, which reached a steady state after ∼10 min. Subsequent pairing (at the time 0, arrow) did not modify GPSC amplitude, suggesting occlusion. While Cα was applied to nine CA3 pyramidal neurons, pairing was performed only on six of nine cells. Insets, Sample traces from an individual experiment taken at the time indicated.
Figure 9.
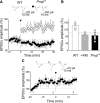
Lack of PKA-dependent LTP at Schaffer collateral-CA1 synapses in the hippocampus of _Prnp_0/0 mice. A, The mean EPSC amplitude recorded before and after pairing (arrow at time 0) is plotted against time in WT (open symbols; n = 6) and in _Prnp_0/0 mice (closed symbols; n = 14). Insets above the graph represent sample traces of Schaffer collateral-CA1 EPSCs obtained in WT and _Prnp_0/0 mice before (left) and after pairing (right). B, Blocking postsynaptic PKA with the membrane-impermeable PKA inhibitor PKI 6-22 prevents LTP induction. Each column represents pairing-induced changes of EPSC amplitude (normalized to prepairing values) in CA1 pyramidal cells from WT animals (WT, white, n = 6), from WT animals in the presence of PKI 6-22 (+PKI, gray, n = 5), and from _Prnp_0/0 mice (_Prnp_0/0, black, n = 14). Data obtained from WT animals in the presence of PKI 6-22 and from _Prnp_0/0 versus WT were significantly different (p < 0.001, 1-way ANOVA). C, Infusion of the constitutively active isoform of PKA catalytic subunit Cα into CA1 pyramidal cells (n = 7) via the patch pipette progressively increased the amplitude of EPSCs evoked by Schaffer collateral stimulation. The amplitude reached a peak after ∼10 min. The pairing protocol (applied at time 0, arrow) failed to modify EPSC amplitude, suggesting occlusion. Insets, Sample traces from an individual experiment taken at the time indicated.
Figure 10.
In _Prnp_0/0 mice, at MF-CA3 synapses, pairing-induced LTD is prevented by blocking G-protein-coupled GluK1 receptors or phospholipase C downstream to G-protein activation. A, The mean amplitude of MF-GPSCs recorded in _Prnp_0/0 mice (n = 9) in the presence of the GluK1 antagonist UBP 302 before and after pairing (arrow at time 0) is plotted versus time. Insets above the graph represent individual traces of MF-GPSCs evoked before (Control) and after pairing. B, Each column represents the mean MF-GPSC amplitude obtained 30 min after pairing and normalized to prepairing values in controls (white, n = 15), in the presence of UBP 302 (black, n = 9), and in the presence of PLC inhibitor U73122 (gray, n = 8). Data obtained in the presence of UBP 302 and U73122 versus controls were significantly different (p < 0.001; 1-way ANOVA).
Figure 11.
At MF-CA3 synapses in slices from _Prnp_0/0 mice, LTD results from the direct effect of pairing on GluK1 receptors. Each column represents the mean MF-GPSC amplitude obtained 30 min after pairing and normalized to prepairing values in control samples (white, n = 15), in the presence of different receptor antagonists (Antag, gray, n = 6), and in the presence of
d
-AP5 (black, n = 7). Receptor antagonists comprise the following: 3 μ
m
CGP 52432, 1 μ
m
atropine, 50 μ
m
dihydro-β-erythroidine, 10 μ
m
8-cyclopentyl-1,3-dipropylxanthine, 50 μ
m
pyridoxal-phosphate-6-azophenyl-2-disulphonic acid, and 100 μ
m
LY341495 to block GABAB, muscarinic, nicotinic, adenosine, purinergic P2Y, and mGluR receptors, respectively. Data obtained in the presence of different receptor antagonists and
d
-AP5 were not significantly different from controls: p = 0.73 and 0.44, respectively (1-way ANOVA).
Similar articles
- Postsynaptic application of a peptide inhibitor of cAMP-dependent protein kinase blocks expression of long-lasting synaptic potentiation in hippocampal neurons.
Duffy SN, Nguyen PV. Duffy SN, et al. J Neurosci. 2003 Feb 15;23(4):1142-50. doi: 10.1523/JNEUROSCI.23-04-01142.2003. J Neurosci. 2003. PMID: 12598602 Free PMC article. - Activation of Group II Metabotropic Glutamate Receptors Promotes LTP Induction at Schaffer Collateral-CA1 Pyramidal Cell Synapses by Priming NMDA Receptors.
Rosenberg N, Gerber U, Ster J. Rosenberg N, et al. J Neurosci. 2016 Nov 9;36(45):11521-11531. doi: 10.1523/JNEUROSCI.1519-16.2016. J Neurosci. 2016. PMID: 27911756 Free PMC article. - Differential maintenance and frequency-dependent tuning of LTP at hippocampal synapses of specific strains of inbred mice.
Nguyen PV, Duffy SN, Young JZ. Nguyen PV, et al. J Neurophysiol. 2000 Nov;84(5):2484-93. doi: 10.1152/jn.2000.84.5.2484. J Neurophysiol. 2000. PMID: 11067991 - Role of giant depolarizing potentials in shaping synaptic currents in the developing hippocampus.
Mohajerani MH, Cherubini E. Mohajerani MH, et al. Crit Rev Neurobiol. 2006;18(1-2):13-23. doi: 10.1615/critrevneurobiol.v18.i1-2.30. Crit Rev Neurobiol. 2006. PMID: 17725505 Review. - Hippocampal long-term synaptic plasticity and signal amplification of NMDA receptors.
MacDonald JF, Jackson MF, Beazely MA. MacDonald JF, et al. Crit Rev Neurobiol. 2006;18(1-2):71-84. doi: 10.1615/critrevneurobiol.v18.i1-2.80. Crit Rev Neurobiol. 2006. PMID: 17725510 Review.
Cited by
- Comparing Prion Proteins Across Species: Is Zebrafish a Useful Model?
Burato A, Legname G. Burato A, et al. Mol Neurobiol. 2024 Jun 25. doi: 10.1007/s12035-024-04324-z. Online ahead of print. Mol Neurobiol. 2024. PMID: 38918277 Review. - Copper coordination modulates prion conversion and infectivity in mammalian prion proteins.
Legname G. Legname G. Prion. 2023 Dec;17(1):1-6. doi: 10.1080/19336896.2022.2163835. Prion. 2023. PMID: 36597284 Free PMC article. Review. - Structural and dynamical determinants of a β-sheet-enriched intermediate involved in amyloid fibrillar assembly of human prion protein.
Russo L, Salzano G, Corvino A, Bistaffa E, Moda F, Celauro L, D'Abrosca G, Isernia C, Milardi D, Giachin G, Malgieri G, Legname G, Fattorusso R. Russo L, et al. Chem Sci. 2022 Aug 5;13(35):10406-10427. doi: 10.1039/d2sc00345g. eCollection 2022 Sep 14. Chem Sci. 2022. PMID: 36277622 Free PMC article. - Loss of prion protein control of glucose metabolism promotes neurodegeneration in model of prion diseases.
Arnould H, Baudouin V, Baudry A, Ribeiro LW, Ardila-Osorio H, Pietri M, Caradeuc C, Soultawi C, Williams D, Alvarez M, Crozet C, Djouadi F, Laforge M, Bertho G, Kellermann O, Launay JM, Schmitt-Ulms G, Schneider B. Arnould H, et al. PLoS Pathog. 2021 Oct 5;17(10):e1009991. doi: 10.1371/journal.ppat.1009991. eCollection 2021 Oct. PLoS Pathog. 2021. PMID: 34610054 Free PMC article. - Study on the Correlation Between NF-κB and Central Fatigue.
Yang X, Li F, Liu Y, Li D, Li J. Yang X, et al. J Mol Neurosci. 2021 Oct;71(10):1975-1986. doi: 10.1007/s12031-021-01803-z. Epub 2021 Feb 14. J Mol Neurosci. 2021. PMID: 33586033 Free PMC article. Review.
References
- Amaral DG, Dent JA. Development of the mossy fibers of the dentate gyrus: I. A light and electron microscopic study of the mossy fibers and their expansions. J Comp Neurol. 1981;195:51–86. - PubMed
- Ben-Ari Y, Gaiarsa JL, Tyzio R, Khazipov R. GABA: a pioneer transmitter that excites immature neurons and generates primitive oscillations. Physiol Rev. 2007;87:1215–1284. - PubMed
- Benvegnù S, Poggiolini I, Legname G. Neurodevelopmental expression and localization of the cellular prion protein in the central nervous system of the mouse. J Comp Neurol. 2010;518:1879–1891. - PubMed
Publication types
MeSH terms
Substances
LinkOut - more resources
Full Text Sources
Other Literature Sources
Molecular Biology Databases
Research Materials
Miscellaneous
