Genome-wide comparison of DNA hydroxymethylation in mouse embryonic stem cells and neural progenitor cells by a new comparative hMeDIP-seq method - PubMed (original) (raw)
Genome-wide comparison of DNA hydroxymethylation in mouse embryonic stem cells and neural progenitor cells by a new comparative hMeDIP-seq method
Li Tan et al. Nucleic Acids Res. 2013 Apr.
Abstract
The genome-wide distribution patterns of the '6th base' 5-hydroxymethylcytosine (5hmC) in many tissues and cells have recently been revealed by hydroxymethylated DNA immunoprecipitation (hMeDIP) followed by high throughput sequencing or tiling arrays. However, it has been challenging to directly compare different data sets and samples using data generated by this method. Here, we report a new comparative hMeDIP-seq method, which involves barcoding different input DNA samples at the start and then performing hMeDIP-seq for multiple samples in one hMeDIP reaction. This approach extends the barcode technology from simply multiplexing the DNA deep sequencing outcome and provides significant advantages for quantitative control of all experimental steps, from unbiased hMeDIP to deep sequencing data analysis. Using this improved method, we profiled and compared the DNA hydroxymethylomes of mouse ES cells (ESCs) and mouse ESC-derived neural progenitor cells (NPCs). We identified differentially hydroxymethylated regions (DHMRs) between ESCs and NPCs and uncovered an intricate relationship between the alteration of DNA hydroxymethylation and changes in gene expression during neural lineage commitment of ESCs. Presumably, the DHMRs between ESCs and NPCs uncovered by this approach may provide new insight into the function of 5hmC in gene regulation and neural differentiation. Thus, this newly developed comparative hMeDIP-seq method provides a cost-effective and user-friendly strategy for direct genome-wide comparison of DNA hydroxymethylation across multiple samples, lending significant biological, physiological and clinical implications.
Figures
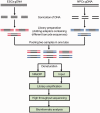
Figure 1.
Schematic diagram of the comparative hMeDIP-seq method.
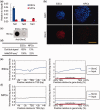
Figure 2.
Differential Tet1/2/3 gene expression and global 5hmC levels in ESCs and NPCs. (a) RT-qPCR analysis of Tet1, Tet2 and Tet3 mRNA levels in ESCs and NPCs (mean values ± SD, n = 3). (b) Immunofluorescence analysis of 5hmC levels in ESCs and NPCs. Bar: 50 μm. (c) Dot blot analysis of the global 5hmC levels in the gDNA of ESCs and ESC-derived NPCs. One hundred fifty nanogram gDNA for each dot. (d) The relative 5hmC signal of dot blot and comparative hMeDIP-seq in ESCs and NPCs. *The ratio of hMeDIP/Input reads numbers in ESCs was set as 100%. (e) Distribution of 5hmC in TSS ± 5 kb and gene body regions in ESCs. (f) Distribution of 5hmC in TSS ± 5 kb and gene body regions in NPCs.
Figure 3.
Correlation between DNA hydroxymethylation and gene expression in ESCs and NPCs. (a) Genes were separated into five groups (from high to low) according to their expression levels in ESCs: top 20%; 20–40%; 40–60%; 60–80%; bottom 20%. The average 5hmC densities of the five groups of genes were plotted across the promoter or gene body regions. Left: TSS ± 5 kb regions. Right: gene body regions. (b) Genes were also separated into five groups according to their expression levels in NPCs. The average 5hmC densities of the five groups of genes were plotted across the promoter or gene body regions. Left: TSS ± 5 kb regions. Right: gene body regions. (c) Genes were classified into two groups with respect to the presence (5hmC+) or absence (5hmC−) of 5hmC peak(s) at their promoters (TSS ± 1 kb) or in gene body regions (from TSS + 1 kb to TES) in ESCs. Gene expression levels were compared between ‘5hmC+’ and ‘5hmC−’ groups. Left: promoter, P = 0; Right: gene body region, P = 1.08358e-13. *P < 0.01. (d) Genes were classified into two groups with respect to the presence (5hmC+) or absence (5hmC−) of 5hmC peak(s) at their promoters (TSS ± 1 kb) or in gene body regions (from TSS + 1 kb to TES) in NPCs. Gene expression levels were compared between ‘5hmC+’ and ‘5hmC−’ groups. Left: promoter, P = 0.0001; Right: gene body region, P = 0. *P < 0.01.
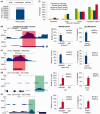
Figure 4.
Identification of DHMRs between ESCs and NPCs. (a) All 5hmC peaks called from the pooled hMeDIP-seq data were separated into three groups: down-regulated (log2 5hmC density ratio ≤ −1), up-regulated (log2 5hmC density ratio ≥ 1) and no significant change (−1 < log2 5hmC density ratio < 1) 5hmC peaks. (b–e) UCSC genome (mmp9) browser screen shots, hMeDIP-qPCR and glucMS-qPCR validation (mean values ± SD, n = 3) of two representative DHMRs with de-hydroxymethylation (Ankrd23 and Hist1h2aa) and two representative DHMRs with de novo hydroxymethylation (Ftl1 and Irf2bp2). (f) Percentages of pooled 5hmC peaks, ‘gain of 5hmC’ peaks and ‘loss of 5hmC’ peaks located at different genomic features.
Figure 5.
Relationship between the changes in DNA hydroxymethylation and gene expression during neural differentiation. (a) Down- and up-regulated genes during neural differentiation were sorted (NPC versus ESC, log2 mRNA expression ratio ≤ −1 or ≥1). The changes in 5hmC peak density at promoters (TSS ± 1 kb) in down- and up-regulated genes were compared during neural differentiation (P = 0). *P < 0.01. (b) The changes in 5hmC peak density at gene body regions (from TSS + 1 kb to TES) in down- and up-regulated genes were compared during neural differentiation (P = 0). *P < 0.01. (c) Dot plotting of the alteration in 5hmC peak density at promoters and the gene expression change during neural differentiation. The changes in 5hmC peak density at promoters (TSS ± 1 kb) were plotted on the y-axis and the corresponding gene expression changes were plotted on the _x_-axis. R2 = 0.0048. (d) Dot plotting of the alteration in 5hmC peak density in gene body regions and the gene expression change during neural differentiation. The changes in 5hmC peak density in gene body regions (from TSS + 1 kb to TES) were plotted on the _y_-axis and the corresponding gene expression changes were plotted on the _x_-axis. R2 = 0.0059.
Similar articles
- Comprehensive evaluation of genome-wide 5-hydroxymethylcytosine profiling approaches in human DNA.
Skvortsova K, Zotenko E, Luu PL, Gould CM, Nair SS, Clark SJ, Stirzaker C. Skvortsova K, et al. Epigenetics Chromatin. 2017 Apr 20;10:16. doi: 10.1186/s13072-017-0123-7. eCollection 2017. Epigenetics Chromatin. 2017. PMID: 28428825 Free PMC article. - Dynamic regulation of 5-hydroxymethylcytosine in mouse ES cells and during differentiation.
Ficz G, Branco MR, Seisenberger S, Santos F, Krueger F, Hore TA, Marques CJ, Andrews S, Reik W. Ficz G, et al. Nature. 2011 May 19;473(7347):398-402. doi: 10.1038/nature10008. Epub 2011 Apr 3. Nature. 2011. PMID: 21460836 - Genome-wide mapping of 5-hydroxymethylcytosine in embryonic stem cells.
Pastor WA, Pape UJ, Huang Y, Henderson HR, Lister R, Ko M, McLoughlin EM, Brudno Y, Mahapatra S, Kapranov P, Tahiliani M, Daley GQ, Liu XS, Ecker JR, Milos PM, Agarwal S, Rao A. Pastor WA, et al. Nature. 2011 May 19;473(7347):394-7. doi: 10.1038/nature10102. Epub 2011 May 8. Nature. 2011. PMID: 21552279 Free PMC article. - Studying the epigenome using next generation sequencing.
Ku CS, Naidoo N, Wu M, Soong R. Ku CS, et al. J Med Genet. 2011 Nov;48(11):721-30. doi: 10.1136/jmedgenet-2011-100242. Epub 2011 Aug 8. J Med Genet. 2011. PMID: 21825079 Review. - TET enzymes and DNA hydroxymethylation in neural development and function - how critical are they?
Santiago M, Antunes C, Guedes M, Sousa N, Marques CJ. Santiago M, et al. Genomics. 2014 Nov;104(5):334-40. doi: 10.1016/j.ygeno.2014.08.018. Epub 2014 Sep 6. Genomics. 2014. PMID: 25200796 Review.
Cited by
- Decoding the Epigenetic Landscape: Insights into 5mC and 5hmC Patterns in Mouse Cortical Cell Types.
Wei X, Li J, Cheng Z, Wei S, Yu G, Olsen ML. Wei X, et al. bioRxiv [Preprint]. 2024 Jul 10:2024.07.06.602342. doi: 10.1101/2024.07.06.602342. bioRxiv. 2024. PMID: 39026756 Free PMC article. Preprint. - Human TSC2 Mutant Cells Exhibit Aberrations in Early Neurodevelopment Accompanied by Changes in the DNA Methylome.
Chalkley ML, Guerin LN, Iyer T, Mallahan S, Nelson S, Sahin M, Hodges E, Ess KC, Ihrie RA. Chalkley ML, et al. bioRxiv [Preprint]. 2024 Jun 6:2024.06.04.597443. doi: 10.1101/2024.06.04.597443. bioRxiv. 2024. PMID: 38895266 Free PMC article. Preprint. - One-pot trimodal mapping of unmethylated, hydroxymethylated, and open chromatin sites unveils distinctive 5hmC roles at dynamic chromatin loci.
Skardžiūtė K, Kvederavičiūtė K, Pečiulienė I, Narmontė M, Gibas P, Ličytė J, Klimašauskas S, Kriukienė E. Skardžiūtė K, et al. Cell Chem Biol. 2024 Mar 21;31(3):607-621.e9. doi: 10.1016/j.chembiol.2023.12.003. Epub 2023 Dec 27. Cell Chem Biol. 2024. PMID: 38154461 Free PMC article. - Epigenetics in psychiatry: Beyond DNA methylation.
Kouter K, Šalamon Arčan I, Videtič Paska A. Kouter K, et al. World J Psychiatry. 2023 Jun 19;13(6):319-330. doi: 10.5498/wjp.v13.i6.319. eCollection 2023 Jun 19. World J Psychiatry. 2023. PMID: 37383287 Free PMC article. Review. - A pilot investigation of differential hydroxymethylation levels in patient-derived neural stem cells implicates altered cortical development in bipolar disorder.
Kumar A, Kos MZ, Roybal D, Carless MA. Kumar A, et al. Front Psychiatry. 2023 Apr 17;14:1077415. doi: 10.3389/fpsyt.2023.1077415. eCollection 2023. Front Psychiatry. 2023. PMID: 37139321 Free PMC article.
References
- Latham T, Gilbert N, Ramsahoye B. DNA methylation in mouse embryonic stem cells and development. Cell Tissue Res. 2008;331:31–55. - PubMed
Publication types
MeSH terms
Substances
LinkOut - more resources
Full Text Sources
Other Literature Sources


